محتوای الکترونیکی
Process Diagram Sample

Write at least 150 words.
Report Plan
Paraphrase: gives information>show a significant comparison; on the ages of the populations of Oman and Spain in 2005;of the age groups in Oman and Spain.
Overview: The pie charts show significant comparison of age groups in Oman and Spain.
Paragraph 2: (1) Talk about the age-groups in Oman in both the given years. Give figures and details.
Paragraph 3: (1) Talk about the age-groups in Spain in both the given years. Give figures and details.
Paragraph 4: (1) Summarize the topic in detail.
Sample Answer
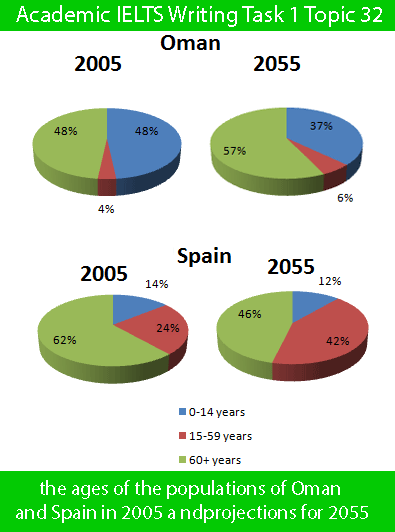
The pie charts show a significant comparison of age groups in Oman and Spain. Initial statistics are concerning 2005, and predictions about the ages of the populations have been made in 2055.
It is apparent from the charts that the people who were under 14 years consisted half of the population of Oman in 2005. A negligible 4% of the population were between 15-59 years. And, another half, which is 49%, was covered by 60+ people. However, the next half-century is assessed to bring staggering alteration of dominant positions in Oman population. Proliferation from 48% to 57% can be cited as an example that will make 60+ years old Oman people prevalent in 2055. While 15-59 years will see a slight increase to 6%, those who are 0-14 years will decrease in population to 37%.
On the other hand, in 2005, 62% of Spanish people were 60+. Predictions about that status illustrate no significant alterations in the dominance of age groups.
Overall, it is important to note that, in 2055, the proportion of people under 14 will slide away in both countries. However, this trend will cause middle-aged people to take over the dominant position solely in Oman.
2 نظر
the provided pie charts make a comparison of age group in Oman and Spain in 2005 and the prospects of population distribution in 2055. overall, people aged 60+ made up the bulk of Spain's and Oman's population in 2005 and and the same result is projected for 2055. Initial statistics shows that next to a half of Omanis were 60+ years old. this figure will have accounted for 57% by 2015. People aged under 14 years old constituted another half of Oman's population in 2005, the respective percentage is predicted to decrease by about 10% in 2055. with people aged between 15 and 59 years old, making up a tiny fraction of the Omanis. respective population will have comprised 6% of whole in 2055. taking Spain into mind, just a bit more than two third of the Spain's population were +60 years old in 2005, this proportion will have dropped to 46% by 2015. on the contrary, the percentage of middle aged group is speculated to ascend twofold in 2055 compared to 2005.
The supplied pies illustrates data on various ages of Spain and Oman population in 2005 and speculations for 2055. Overall, in both mentioned countries the population of 0-14 years will decrease projections. As data suggests, just under a half of Oman’s population was covered 60+ years in 2005; while, it will have a 19% rise in 2055. The 0-14 years comprised 48% of the whole population, and in 2055, this percentage will experience a mild drop with a small minority. In 2005, the 15 to 59 years made up an insignificant minority in Oman, and they didn’t foresee a dramatic change in 2055. In 2005, In Spain the majority of population consist of 60+ Years; however, it will witness a reduction about 18% in speculation. While 15 to 59 years included one quarter of the population , it will account for 42% in the next half-century. There isn’t a widening gap between the percentage of the 0-14 in 2005 and the next 50 years, both of them cover just a small minority.
لطفا وارد شوید و نظر خود را ثبت نمایید.
بهترین ها
| نام | تعداد آزمون | میزان موفقیت | |
|---|---|---|---|
| َAmeneh Darvishzadeh | 1 | 100/00 % | |
| Mehrad Hashemi | 1 | 100/00 % | |
| مهدی حسین پور آقائی | 1 | 100/00 % | |
| Farnoush Toghiany | 21 | 98/36 % | |
| zahra namdari | 46 | 98/21 % | |
| یاسمن محمدی پور | 4 | 98/08 % | |
| Sheida Taheri | 3 | 97/37 % | |
| پژمان همدانی | 3 | 97/37 % | |
| محمدحسین میرزایی | 3 | 97/30 % | |
| Tara Mohammadi | 3 | 96/43 % | |
| yasaman mohamadipur | 51 | 95/86 % | |
| محمدجواد ملائی اردستانی | 3 | 94/44 % | |
| Arzhang Saberi | 4 | 93/33 % | |
| Soheila Karimi | 124 | 92/73 % | |
| aram farhmand | 10 | 92/31 % | |
| یاشار اسکندری | 98 | 91/14 % | |
| الشان مقیمی آذر | 11 | 90/80 % | |
| عباس پورمیدانی | 1 | 90/00 % | |
| پریسا سلوکی شهرضایی | 72 | 89/49 % | |
| ارشیا قلمکاری | 33 | 89/23 % |


