محتوای الکترونیکی
Pie Chart Sample

Write at least 150 words.
Report Plan
Paraphrase: shows>demonstrate; spending habits>spending patterns
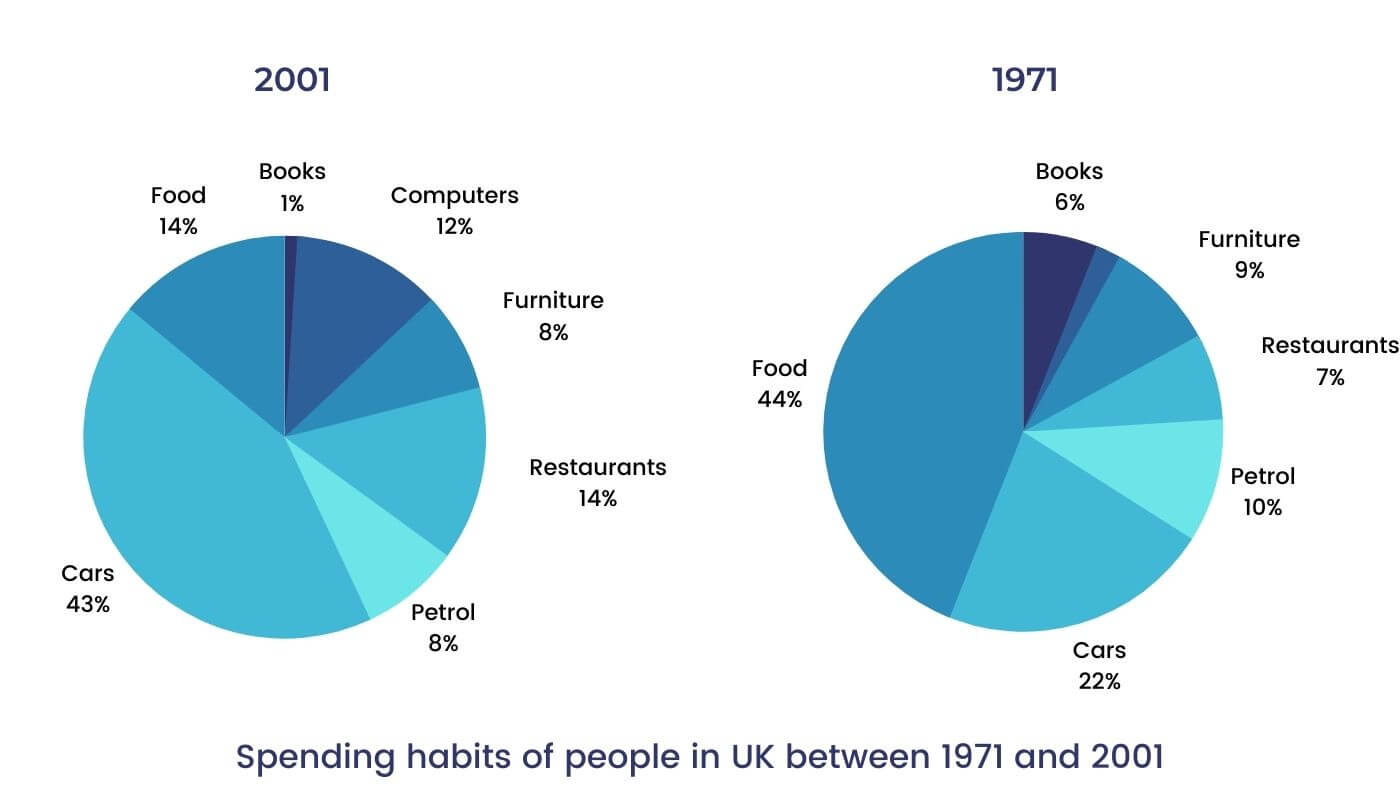
Overview: The graphs show changes in spending habits of people in UK between 1971 and 2001.
Paragraph 2: (1) Compare the expenses on different commodities. Give figures.
Paragraph 3: (1) Compare the expenses on different commodities. Give figures.
Sample Answer
The pie charts demonstrate changes in the spending patterns between 1971 and 2001 in the UK.
The overall trend shows an increased amount of money spent on cars, computers and eating out.
Talking about it in detail, food and car turned out to be the two biggest items of expenditure in both the given years. Together, they encompassed more than half of household spending in the UK. In 1971, food accounted for 44% of the expenditure. In 2001, it saw a drop by two thirds and reached up to 14%. Also, the spending on cars turned twice, increasing from 22% to 43%.
Significant change can be seen in other areas as well. Outlay on eating out doubled, climbing from 7% to 14%. A dramatic increase in the proportion of salary spent on computers can also be observed, up from 2% to 12%. However, with a striking upsurge in computer expenditure, the percentage of expenditure on books plunged from 6% to 1%.
15 نظر
The pie charts compare the percentage of expenditure by the people in the UK on seven different categories. Figures are given for the years 1971 and 2001. In general, there were higher percentages of expenditure on food, furniture and petrol in 1971 than that in 2001. In contrast, the year 2001 had higher percentages of spending on cars, restaurants and computers. The spending on cars in 1971 comprised 22 percent in whole spending habits while the figure for 2001 came first with 43 percent. There was a significant climb in the amount of money spent on computers from to 2 to 12 percent between 1971 and 2001. The expenditure on restaurants increased from 7 to 14 percent during the same period. The expenditure of food was the highest to 44 percent in 1971, but later dropped to 14 percent in 2001. The spending on books plunged a slight decrease from 6 to only 1 percent from 1971 to 2001. Another noticeable features from the chart is that the expenditure on furniture and petrol were the same over the 1971-2001 period with 9 and 9.5 percent. Overall, with the development of technology, the spending on computers and cars went up.
the diagram represents information on spending habits of people in UK between 1971 and 2001.The overall trend shows an increased amount of money spent on cars, computers and eating out. Az is observed in this pie chart shows that unfortunatly During these few years, the average book reading has decreased a lot, and in return, food has taken up a large part of it.
The given pie charts illustrate the altering expending habits in seven items among the UK people. The changings are related to cars, food, book, furniture, restaurants, and petrol from 1971 to 2001. Generally speaking, the comparison of the two charts represents the proportion of spending habits for books has been the least segment of the charts. while cars and foods have been popular the most.
the supplied pie charts shows data on spending habits of people in UK between 1971 and 2001. as is presented shows an upward trend amount of money spent on cars, computers and eating out. as is observed the figures for spending habits for books has declined a lot, however cars and foods have increased sharply in 2001
the supplied illustration depicts the comparison of spending habits of people in the UK between 1971 and 2001.According to this figure, the biggest change has been in eating habits and cars. In 1971, 44% of the expenses were spent on food and 22% on buying a car, and in 2001, 43% of the expenses were spent on buying a car.
The pie chart shows the changes in the spending pattern of people in the UK, between 1971 and 2001. Overall, the biggest living expenses were food and cars, which together accounted for more than half of household spending in the UK. It has increased the most in cars, computers and eating out. While the most significant reduction is related to food and books. in partial mode, from 1971 to 2001, the trend in car costs doubled, increasing from 22% to 43%. The same trend can be seen in the cost of eating out, which climbing from 7% to 14%. Can also be observed a significant increase in the proportion of salaries spent on computers, up from 2% to 12%. In 1971, food accounted for 44 percent of expenditures. In 2001, it dropped by two-thirds to 14 percent. On the other hand, The book expenditure also plunged by one-sixth from 6% to 1%. In other cases, minor changes can be seen, a two percent decrease in petrol and a one percent down in furniture.
The pie chart shows the changes in the spending pattern of people in the UK, between 1971 and 2001. Overall, the biggest living expenses were food and cars, which together accounted for more than half of household spending in the UK. It has increased the most in cars, computers and eating out. While the most significant reduction is related to food and books. In partial mode, from 1971 to 2001, the trend in car costs doubled, increasing from 22% to 43%. The same trend can be seen in the cost of eating out, which climbing from 7% to 14%. Can also be observed a significant increase in the proportion of salaries spent on computers, up from 2% to 12%. In 1971, food accounted for 44 percent of expenditures. In 2001, it dropped by two-thirds to 14 percent. On the other hand, The book expenditure also plunged by one-sixth from 6% to 1%. In other cases, minor changes can be seen, a two percent decrease in petrol and a one percent down in furniture.
The presented pie chart depicts the information of habit changes over a period of 30 years in the UK .
Generally, major proportion in people's spending habits belongs to food in 1971 and cars in 2001. the least propertion belongs to books in 1971 and has remaind the same for 2001.
the given pie chart shows data on changing of spending habits of people in UK between 1971 to 2001.
The provided pie chart illustrates the comparison of spending patterns of people in the UK between 1971 and 2001.
the supplied figure represents the comparison of changes in the spending patterns between 1971 and 2001 in the UK.
The given pie charts illustrate the changes pattern of people who lived in The UK from 1971 to 2001. Overall, while cars represented the highest proportion of spending habits in 2001, food was the first habit the population spent their time on. At one glance, furniture almost stayed unchanged during the time period. Talking about in detail, the figures for restaurants turned twice, increasing from 7% to 14%. In addition, over the time period the outlay on books reduced to an insignificant minority. Cars expenditure jumped dramatically and comprised around 45% of whole charts over the past 30 years. In 2001 petrol saw a slight drop to just under one in tenth. Turning to the rest of the graphs, a considerable go up in the proportion of salary spent on computers can be observed, up from 2% to 12%. However, with a striking upsurge in computers, the percentage of food expenditure in The UK plunged to just under 15%.
The charts show the changes in british people habits on 2001 compare to 1971 overall, by looking at the charts it can be seen that eating out was the most likely habit for UK people on 1971 while this place changed to spending on cars on 2001.
لطفا وارد شوید و نظر خود را ثبت نمایید.
بهترین ها
| نام | تعداد آزمون | میزان موفقیت | |
|---|---|---|---|
| َAmeneh Darvishzadeh | 1 | 100/00 % | |
| Mehrad Hashemi | 1 | 100/00 % | |
| مهدی حسین پور آقائی | 1 | 100/00 % | |
| Farnoush Toghiany | 21 | 98/36 % | |
| zahra namdari | 46 | 98/21 % | |
| یاسمن محمدی پور | 4 | 98/08 % | |
| Sheida Taheri | 3 | 97/37 % | |
| پژمان همدانی | 3 | 97/37 % | |
| محمدحسین میرزایی | 3 | 97/30 % | |
| Tara Mohammadi | 3 | 96/43 % | |
| yasaman mohamadipur | 51 | 95/86 % | |
| محمدجواد ملائی اردستانی | 3 | 94/44 % | |
| Arzhang Saberi | 4 | 93/33 % | |
| Soheila Karimi | 124 | 92/73 % | |
| aram farhmand | 10 | 92/31 % | |
| یاشار اسکندری | 98 | 91/14 % | |
| الشان مقیمی آذر | 11 | 90/80 % | |
| عباس پورمیدانی | 1 | 90/00 % | |
| پریسا سلوکی شهرضایی | 72 | 89/49 % | |
| ارشیا قلمکاری | 33 | 89/23 % |


