محتوای الکترونیکی
Pie Chart Sample
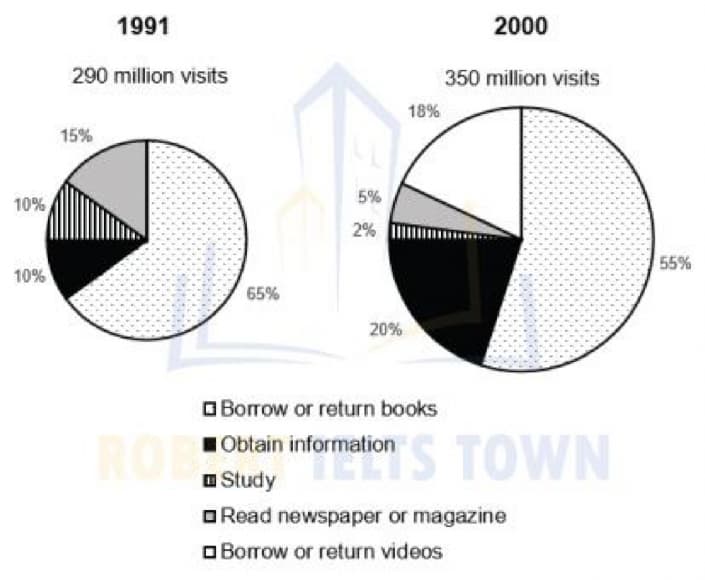
You should spend about 20 minutes on this task. The pie charts show figures for the use of public libraries in 1990 and 2000 in Britain.
Summarise the information by selecting and reporting the main features, and make comparisons where relevant.
Write atleast 150 words.
Sample Answer
The pie charts provide information about the purposes of people who visited public libraries in Britain in two years.
It is evident that the most common use of people going to the libraries was to borrow or return books, and there was a new library’s function in 2000.
Vocabulary
- The pie charts provide information about
- It is evident that
- In particular
- Followed by
- The proportion of people
- A considerable decline
- Doubled to
- Fell sharply to
- Constituted
11 نظر
The presented pie charts comparatively indicate the utilize Britain individuals of public libraries facilities in 1991 and 2000. In general, it's clear that the number of people who visited the public libraries has obviously accelerated in 2000 and additionally, in the two charts, the most using portion has belonged to the read newspaper or magazine segment.
The given pie charts represent the proportion of figures for the use of public libraries in 1990 and 2000 in Britain.,As is observed,the number of people who going to the libraries was to borrow or return book has rocketed,
the given pie chart presents information about the purposes of people who visited libraries in Britain in two years. According to the pie chart, the least common use of people visiting libraries was to read at the library.
The pie charts shows data on the purposes of people who visited public libraries in Britain in 1991 and 2000.in common, the figures for people who visited the public libraries has dramatically uplifted in 2000.it is clear that the most common use of people going to the libraries was to borrow or return books, and there was a new library’s function in 2000.
The supllied pie chart present the information of the difference in people's goals in getting books from the library in two years .
Overall, the most use of people going to libraries is borrowing or returning books and it has been added a new function in 2000.
shown pie chart compares information of the purpose of people who visited public libraries in Britain in two years.
The presented pie charts illustrate the amount of use of public libraries between 1991 and 2000 in Britain.
the provided presentation depicts the number of the purposes of people who visited public libraries in Britain in two years.
The provided charts illustrate the percentage of visiting public libraries in the UK from 1990 to 2000. Overall, it is clear that over the past 9 years the proportion of borrowed or returned books slightly decreased, while borrowing of returning videos was sharply jumped. In terms of the biggest changes in the graphs, the figure for obtaining information turned twice, increased considerably from on in tenth to one fifth. In addition, a rapid go up in the proportion of visiting public libraries on borrow or return videos can be observed, up to just under 20% over the time. However, with the striking upsurge in lending or returning videos, the proportion of visitors to study plunged to an insignificant minority in 2000. Turning to the rest of the pie charts, despite dropping gradually by 10% in the number of populations who visit the public libraries for borrowing or returning books, till 2000 it was still responsible for the highest percentage of the whole graph. Finally, reading newspapers or magazines accounted for one in twentieth.
The presented pie charts compares the number of people using public libraries in Britain between 1991 and 2000, based on their aim of visits. As is evident, borrowing and returning books was the prevailing purpose among the library-goers (the whole time).
لطفا وارد شوید و نظر خود را ثبت نمایید.
بهترین ها
| نام | تعداد آزمون | میزان موفقیت | |
|---|---|---|---|
| َAmeneh Darvishzadeh | 1 | 100/00 % | |
| Mehrad Hashemi | 1 | 100/00 % | |
| مهدی حسین پور آقائی | 1 | 100/00 % | |
| Farnoush Toghiany | 21 | 98/36 % | |
| zahra namdari | 46 | 98/21 % | |
| یاسمن محمدی پور | 4 | 98/08 % | |
| Sheida Taheri | 3 | 97/37 % | |
| پژمان همدانی | 3 | 97/37 % | |
| محمدحسین میرزایی | 3 | 97/30 % | |
| Tara Mohammadi | 3 | 96/43 % | |
| yasaman mohamadipur | 51 | 95/86 % | |
| محمدجواد ملائی اردستانی | 3 | 94/44 % | |
| Arzhang Saberi | 4 | 93/33 % | |
| Soheila Karimi | 124 | 92/73 % | |
| aram farhmand | 10 | 92/31 % | |
| یاشار اسکندری | 98 | 91/14 % | |
| الشان مقیمی آذر | 11 | 90/80 % | |
| عباس پورمیدانی | 1 | 90/00 % | |
| پریسا سلوکی شهرضایی | 72 | 89/49 % | |
| ارشیا قلمکاری | 33 | 89/23 % |


