محتوای الکترونیکی
Pie Chart Sample
Write at least 150 words.
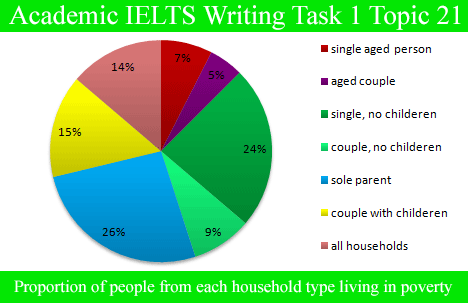
Proportion of people from each household type living in poverty
Report Plan
Paraphrase: shows>inspects; proportion of different categories of families living in poverty in the UK >the different family types living in poor conditions in the UK
Overview: The pie chart examines the different type of families who were living in poor conditions in UK in the year 2002.
Paragraph 2: (1) Compare different categories. Give figures.
Paragraph 3: (1) Compare different categories. Give figures.
Sample Answer
The pie chart inspects the different family types living in poor conditions in the UK in 2002.
At a glance, in the given year, 14% of the entire households in the country were in circumstances of poverty. In comparison to the couples, singles struggled more. Talking about people with children, single parents presented the maximum percentage of 26% amongst all the specified categories, whereas couples with children reported a comparatively lesser percentage of 15%.
As far as the people with no children are concerned, single people were of the hefty percentage, 24%, almost the same number for single people with children. On the contrary, merely 9% of the couples without any children agonized from poverty in 2002. Coming to aged people, singles had a somewhat higher percentage in comparison to couples. Only 7% and 5% of the aged population had difficulties in their living conditions.
1 نظر
بهترین ها
| نام | تعداد آزمون | میزان موفقیت | |
|---|---|---|---|
| َAmeneh Darvishzadeh | 1 | 100/00 % | |
| Mehrad Hashemi | 1 | 100/00 % | |
| مهدی حسین پور آقائی | 1 | 100/00 % | |
| Farnoush Toghiany | 21 | 98/36 % | |
| zahra namdari | 46 | 98/21 % | |
| یاسمن محمدی پور | 4 | 98/08 % | |
| Sheida Taheri | 3 | 97/37 % | |
| پژمان همدانی | 3 | 97/37 % | |
| محمدحسین میرزایی | 3 | 97/30 % | |
| Tara Mohammadi | 3 | 96/43 % | |
| yasaman mohamadipur | 51 | 95/86 % | |
| محمدجواد ملائی اردستانی | 3 | 94/44 % | |
| Arzhang Saberi | 4 | 93/33 % | |
| Soheila Karimi | 124 | 92/73 % | |
| aram farhmand | 10 | 92/31 % | |
| یاشار اسکندری | 98 | 91/14 % | |
| الشان مقیمی آذر | 11 | 90/80 % | |
| عباس پورمیدانی | 1 | 90/00 % | |
| پریسا سلوکی شهرضایی | 72 | 89/49 % | |
| ارشیا قلمکاری | 33 | 89/23 % |


