محتوای الکترونیکی
Pie Chart Sample

Write at least 150 words.
Report Plan
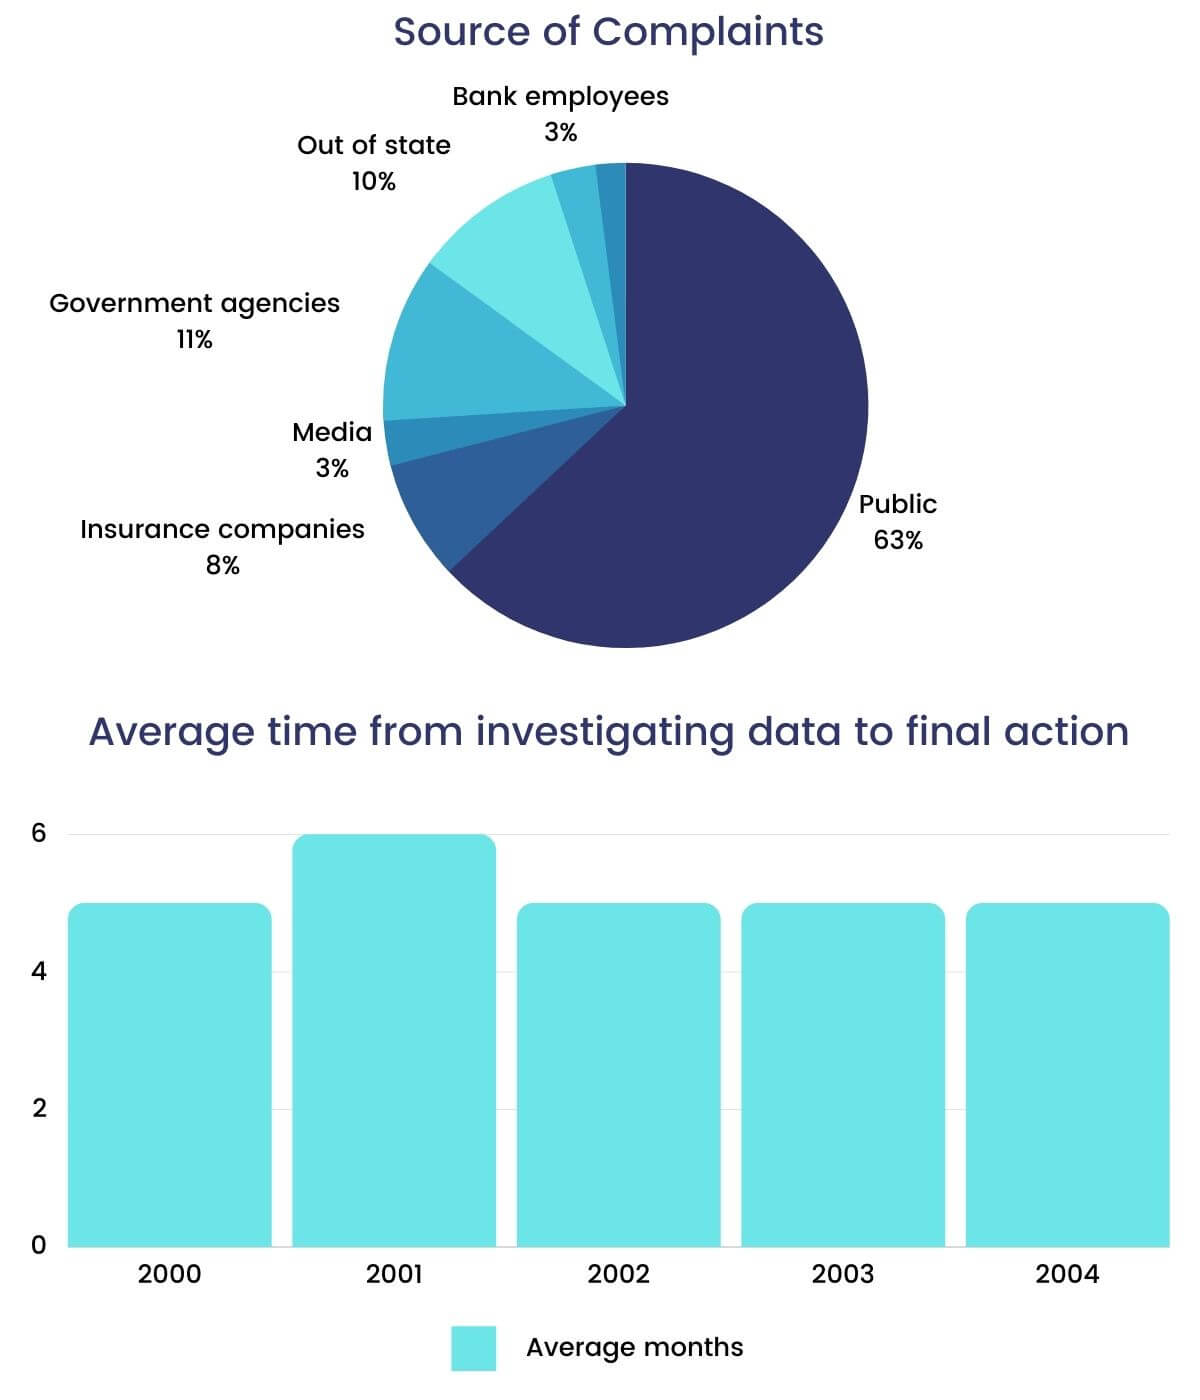
Overview: The two graphs depict different information related to complaints within the bank of America. The pie graph shows the sources of complaints, while the bar graph illustrates the average time taken between the investigation into complaints and the final action taken.
Paragraph 2: (1) Compare the sources of complaints. Give figures.
Paragraph 3: (1) Compare the sources of complaints. Give figures.
Sample Answer
The two graphs portray dissimilar information associated with grievances within the bank of America. The pie graph displays the sources of complaints, while the bar graph demonstrates the average time taken between the enquiry into complaints and the final action taken.
At a glance, the public put forth the highest number of complaints, which is 63% of all, against the bank of America. The bar graph represents that it takes an average of 5 months to take action and resolve issues. Of the remaining complaints, the figures can be divided into 11% and 8%, made up of government agencies, out-of-state agencies, and insurance companies. Interestingly, media and bank employees took up 3% of the figure in the chart.
As per the bar graph, 2001 recorded the maximum waiting time for medical misconduct complaints at 6 months. However, there is a noteworthy decline from 6 months in 2001 to 5 months in 2002, all preceding and scheduled years to display an average waiting period of 5 months.
2 نظر
the given pie chart shows data about information on the source of complaints about the bank and the amount of time to have the complaints resolved in America.
Overall,the highest source of complaints belongs to Public complaints while the lowest that belongs to Media and bank employees.in addition as indicated by the bar chart, the average time from investigating data to final action from 2000 to 2004 except for 2001 has remained almost constant .
لطفا وارد شوید و نظر خود را ثبت نمایید.
بهترین ها
| نام | تعداد آزمون | میزان موفقیت | |
|---|---|---|---|
| َAmeneh Darvishzadeh | 1 | 100/00 % | |
| Mehrad Hashemi | 1 | 100/00 % | |
| مهدی حسین پور آقائی | 1 | 100/00 % | |
| Farnoush Toghiany | 21 | 98/36 % | |
| zahra namdari | 46 | 98/21 % | |
| یاسمن محمدی پور | 4 | 98/08 % | |
| Sheida Taheri | 3 | 97/37 % | |
| پژمان همدانی | 3 | 97/37 % | |
| محمدحسین میرزایی | 3 | 97/30 % | |
| Tara Mohammadi | 3 | 96/43 % | |
| yasaman mohamadipur | 51 | 95/86 % | |
| محمدجواد ملائی اردستانی | 3 | 94/44 % | |
| Arzhang Saberi | 4 | 93/33 % | |
| Soheila Karimi | 124 | 92/73 % | |
| aram farhmand | 10 | 92/31 % | |
| یاشار اسکندری | 98 | 91/14 % | |
| الشان مقیمی آذر | 11 | 90/80 % | |
| عباس پورمیدانی | 1 | 90/00 % | |
| پریسا سلوکی شهرضایی | 72 | 89/49 % | |
| ارشیا قلمکاری | 33 | 89/23 % |


