محتوای الکترونیکی
Table Sample

Report Plan
Paraphrase: correlation of the table >the table shows a clear correlation
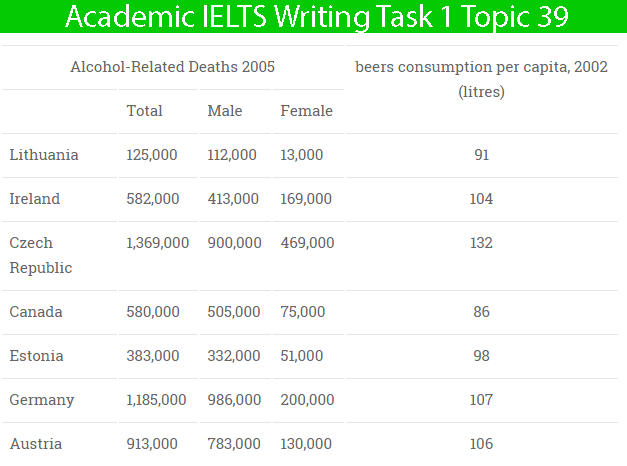
Overview: The table shows a clear correlation between the litres of beer consumed per capita and the number of alcohol-related deaths.
Paragraph 2: (1) Compare the alcohol-consumption statistics and the death rates in given countries. Give figures.
Paragraph 3: (1) Compare the alcohol-consumption statistics and the death rates in given countries. Give figures.
Sample Answer
The table shows a clear correlation between the litres of beer consumed per capita and the number of alcohol-related deaths.
The table illustrates that the greatest beer consumption in 2002 was found in the Czech Republic, Germany and Austria. Not just that, by far, each of these regions also had the largest litres of alcohol-related deaths in 2005. With the greatest beer consumption per litre, namely over 130 for 2002, the Czech Republic also experienced well over one million litres of alcohol-related deaths by 2005. The region with the second-highest beer consumption was Germany, with nearly 107 litres, and it also recorded the second-highest number of alcohol-related deaths, explicitly 1.185 million.
In all regions except Canada, it can be seen that the higher the beer consumption, the higher the alcohol-related mortality rate. Interestingly, in Canada the level of beer consumption is the lowest at 86 per capita. In terms of mortality rate in this country, it is as high as in Ireland, accounting to 0.58 million. However, in the latter, the consumption level was high. Clearly, other health or economic factors must be involved. It is also interesting to note that in each case, the numbers of female deaths were significantly lower than that of males, which seems to be a reflection of the fact that, in general, far fewer women than men drink.
3 نظر
The provided table figures the proportion of beer consumed and amount of alcohol-related deaths in seven metropolitans.
presented table describes a correlation between the litres of beer used per capita and the number of alcohol-related deaths.
the given illustration shows the number of liters of beer consumed per capita and the number of alcohol-related deaths.
لطفا وارد شوید و نظر خود را ثبت نمایید.
بهترین ها
| نام | تعداد آزمون | میزان موفقیت | |
|---|---|---|---|
| َAmeneh Darvishzadeh | 1 | 100/00 % | |
| Mehrad Hashemi | 1 | 100/00 % | |
| مهدی حسین پور آقائی | 1 | 100/00 % | |
| Farnoush Toghiany | 21 | 98/36 % | |
| zahra namdari | 46 | 98/21 % | |
| یاسمن محمدی پور | 4 | 98/08 % | |
| Sheida Taheri | 3 | 97/37 % | |
| پژمان همدانی | 3 | 97/37 % | |
| محمدحسین میرزایی | 3 | 97/30 % | |
| Tara Mohammadi | 3 | 96/43 % | |
| yasaman mohamadipur | 51 | 95/86 % | |
| محمدجواد ملائی اردستانی | 3 | 94/44 % | |
| Arzhang Saberi | 4 | 93/33 % | |
| Soheila Karimi | 124 | 92/73 % | |
| aram farhmand | 10 | 92/31 % | |
| یاشار اسکندری | 98 | 91/14 % | |
| الشان مقیمی آذر | 11 | 90/80 % | |
| عباس پورمیدانی | 1 | 90/00 % | |
| پریسا سلوکی شهرضایی | 72 | 89/49 % | |
| ارشیا قلمکاری | 33 | 89/23 % |


