محتوای الکترونیکی
Table Sample

Write at least 150 words.
Report Plan
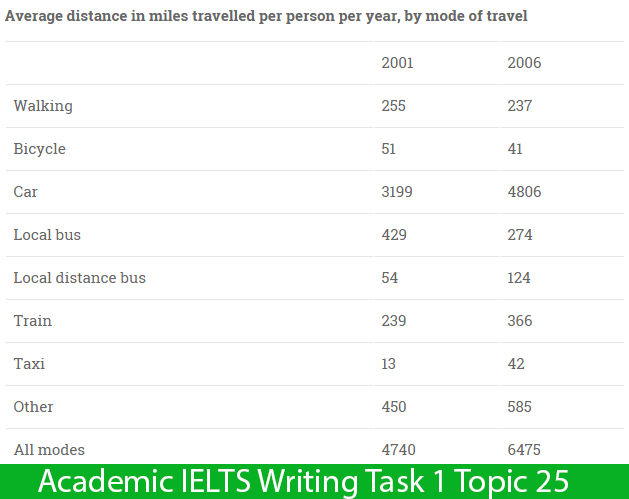
Overview: The chart illustrates average distance travelled by various modes of transport in Netherland in 2001 and 2006.
Paragraph 2: (1) Compare the statistics of different modes in detail. Give figures.
Paragraph 3: (1) Compare the statistics of different modes in detail. Give figures.
Sample Answer
The chart demonstrates the difference between the average distance travelled by a person in numerous transportation modes in Netherland in 2001 and 2006. In an overview, residents of Netherland commuted more in 2006 than 2001. Cars presented unmatched statistics among the provided categories. Excluding walking, bicycles and local buses, most of the remaining categories displayed overall growths in the distance travelled.
In detail, in 2001, a person covered 3,199 miles on average while driving his own car. And this average distance increased to 4,806 miles in 2006. Apart from this mode of conveyance, taking trains, using long-distance buses and taxis also had significant growth in their figures, which went from 289 miles to 366, from 54 miles to 124, and from 13 miles to 42 respectively.
On the contrary, walking and riding bicycles were not much favoured. Both of these categories showed a modest decline in their figures. Meanwhile, the number of people who used local buses also dropped significantly as the average distance experienced a dramatic fall from 429 miles in 2001 to 274 miles in 2006.
2 نظر
The presented table illustrates the differences between distance travelled by various transportation modes in Netherland in the one period five years.
the supplied flow chart shows data about the comparison of the difference between the average distance traveled by a person in numerous transportation modes in the Netherland in 2001 and 2006.
لطفا وارد شوید و نظر خود را ثبت نمایید.
بهترین ها
| نام | تعداد آزمون | میزان موفقیت | |
|---|---|---|---|
| َAmeneh Darvishzadeh | 1 | 100/00 % | |
| Mehrad Hashemi | 1 | 100/00 % | |
| مهدی حسین پور آقائی | 1 | 100/00 % | |
| Farnoush Toghiany | 21 | 98/36 % | |
| zahra namdari | 46 | 98/21 % | |
| یاسمن محمدی پور | 4 | 98/08 % | |
| Sheida Taheri | 3 | 97/37 % | |
| پژمان همدانی | 3 | 97/37 % | |
| محمدحسین میرزایی | 3 | 97/30 % | |
| Tara Mohammadi | 3 | 96/43 % | |
| yasaman mohamadipur | 51 | 95/86 % | |
| محمدجواد ملائی اردستانی | 3 | 94/44 % | |
| Arzhang Saberi | 4 | 93/33 % | |
| Soheila Karimi | 124 | 92/73 % | |
| aram farhmand | 10 | 92/31 % | |
| یاشار اسکندری | 98 | 91/14 % | |
| الشان مقیمی آذر | 11 | 90/80 % | |
| عباس پورمیدانی | 1 | 90/00 % | |
| پریسا سلوکی شهرضایی | 72 | 89/49 % | |
| ارشیا قلمکاری | 33 | 89/23 % |


