محتوای الکترونیکی
Table Sample

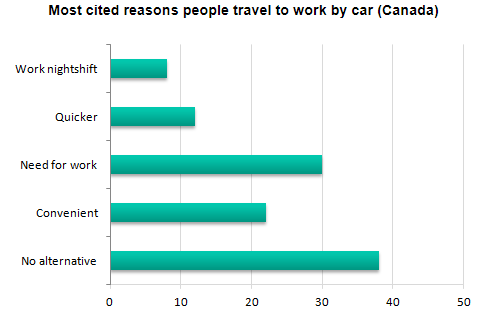
The table shows the percentage of journeys made by different forms of transport in four countries, The bar graph shows the results of a survey into car use.
Summarise the information by selecting and reporting the main features, and make comparisons where relevant.
Write at least 150 words.
| Journeys made by | Canada | Belgium | Germany | Netherlands |
| Car | 90% | 72% | 68% | 47% |
| Bicycle | 1% | 2% | 2% | 26% |
| Public transport | 3% | 12% | 18% | 8% |
| On foot | 5% | 11% | 11% | 18% |
| Other | 1% | 3% | 1% | 1% |
Report Plan
Paraphrase: shows>helps compare; journeys made by different forms of transport>modes of transport used Overview: The table compares modes of transport used in four countries. Paragraph 2: (1) Compare the common transport modes used in different countries. Give figures. Paragraph 3: (1) Talk about the reason behind the cars being the most preferred choice. Give figures.
Sample Answer
The table helps compare modes of transport used in four countries: Canada, Belgium, Germany, and the Netherlands.
As evident from the table, cars are the most frequently used transport form in all four countries. However, the proportion of journeys made by this vehicle ranges from a low of 47% in the Netherlands to a high of 90% in Canada. Unsurprisingly, Netherlands has a high proportion of trips made by bicycle, accounting for 26% and on foot, which is 18%. Germany is the country with the highest rate of public transport use, where approximately one in five journeys is made by public transport.
The bar chart also depicts helpful information in understanding the high use of the car in Canada. The most commonly quoted reason is the absence of any other alternative (38%). Although 22% of people said it is more convenient to travel through a car, the other listed factors illustrate needs more than preferences, e.g. working night shift.
4 نظر
The given table provided the proportion of modes of transportation in four countries and the bar chart depicts the most reasons people use car in Canada.
The given table provided the proportion of modes of transportation in four countries and the bar chart depicts the most reasons people use car in Canada.
the shown table presents information about data on modes of transport used in four countries: Canada, Belgium, Germany, and the Netherlands.
لطفا وارد شوید و نظر خود را ثبت نمایید.
بهترین ها
| نام | تعداد آزمون | میزان موفقیت | |
|---|---|---|---|
| َAmeneh Darvishzadeh | 1 | 100/00 % | |
| Mehrad Hashemi | 1 | 100/00 % | |
| مهدی حسین پور آقائی | 1 | 100/00 % | |
| Farnoush Toghiany | 21 | 98/36 % | |
| zahra namdari | 46 | 98/21 % | |
| یاسمن محمدی پور | 4 | 98/08 % | |
| Sheida Taheri | 3 | 97/37 % | |
| پژمان همدانی | 3 | 97/37 % | |
| محمدحسین میرزایی | 3 | 97/30 % | |
| Tara Mohammadi | 3 | 96/43 % | |
| yasaman mohamadipur | 51 | 95/86 % | |
| محمدجواد ملائی اردستانی | 3 | 94/44 % | |
| Arzhang Saberi | 4 | 93/33 % | |
| Soheila Karimi | 124 | 92/73 % | |
| aram farhmand | 10 | 92/31 % | |
| یاشار اسکندری | 98 | 91/14 % | |
| الشان مقیمی آذر | 11 | 90/80 % | |
| عباس پورمیدانی | 1 | 90/00 % | |
| پریسا سلوکی شهرضایی | 72 | 89/49 % | |
| ارشیا قلمکاری | 33 | 89/23 % |


