محتوای الکترونیکی
Table Sample

Write at least 150 words.
Report Plan
Paraphrase: shows>compares; social and economic indicators for four countries >socio-economic pointers
Overview: The available table compares UN data on socio-economic pointers in 1994 for four countries, namely Japan, Canada, Peru, and Zaire.
Paragraph 2: (1) Talk about the highest and the lowest indicators.
Paragraph 3: (1) Talk about different indicators of the given countries. Give figures.
Paragraph 4: (1) Talk about different indicators of the given countries. Give figures.
Sample Answer
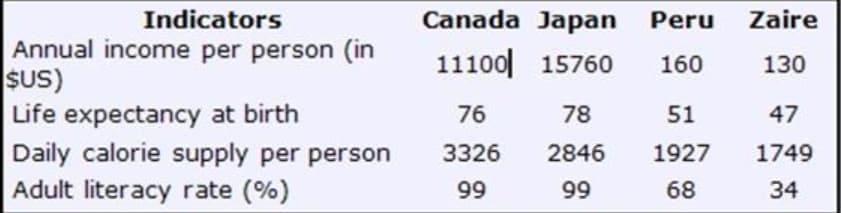
The available table compares UN data on socio-economic pointers in 1994 for four countries, namely Japan, Canada, Peru, and Zaire.
At a glance, it is evident that the statistics for all four indicators were steadily higher in Canada and Japan. Additionally, Zaire had the least number for each of the indicators.
The annual income per person in Japan was $15760, considerably ahead of Canada with $11100. There was a dramatic gap between Peru and Zaire, where the annual income per person was $160 and $130 respectively. In terms of life expectancy, this was similar in Japan (78 years) and Canada (76 years), but it was much lower in Peru (51 years) and just 47 years in Zaire.
Canada headed the table for daily calorie supply per person. Its calorie intake of 3326 is way higher than the 2846 in Japan, 1927 in Peru, and 1749 in Zaire. While the adult literacy rate was almost 100% in Canada and Japan, only 68% of people in Peru and 34% of those in Zaire were literate.
2 نظر
The provided table makes a comparison among four nations, namely Canada, Japan, Peru and Zaire in socio-economic symbols according to the data compiled by UN. Overall, Canada and Japan have the highest number in four mentioned criteria, while Zaire has the least indicators out of all. With $157600 income per person, Japan stood at the top position, which is considerably more than the two bottom countries in the list namely Peru an Zaire, with $ 160 and $130, respectively; while, Canada by about $4000 less than Japan was at the second top position. Similarly, the figure for life expectancy for Japan came in at 78 year, which was three year more than that for Canada, whereas Peru with 51 and 47 years attained third and fourth place in the table. Regarding daily calorie supply for each person, Canada was leader by 3326 calorie per person, Japan with about 500 calorie lower than that for Canada was the second country. The results for adult literacy rate were a tie for Canada and Japan, which was next to 100% of whole. This percentage accounted for %99 with Peru. The figure for Zaire was one third of that for Canada and Japan in Adult literacy.
The supplied table illustrates social and economic signs among four nations, based on United Nations statistics. Overall, Statistics for all four countries demonstrated Canada and Japan achieved the greatest number; whereas, Zaire had the least figure for each indicators. As data suggests that, annual income per person in Japan was 15760$, considerably ahead of Canada with 11100$; while, Canada with 3326 daily calorie supply per person stood at the first place among four countries, and Japan was placed in the second position with 2846 calorie per person. With the same figure Canada and Japan headed the table, with 76 and 99 respectively, for life expectancy at birth and adult literacy rate. Although there was a mild gap between Peru and Zaire, Peru witnessed substantial number in compare to Zaire. With 1927 and 1749 calorie per person, Peru and Zaire respectively, attained at the third and fourth places. There was widening gap between Peru and Zaire with Canada and Japan in annual income per person. People of Zaire earned the least income among mentioned countries which was about 130$. Percentage of adult literacy in Canada and Japan were threefold higher than Peru, and Peru was three times as much as Zaire.
لطفا وارد شوید و نظر خود را ثبت نمایید.
بهترین ها
| نام | تعداد آزمون | میزان موفقیت | |
|---|---|---|---|
| َAmeneh Darvishzadeh | 1 | 100/00 % | |
| Mehrad Hashemi | 1 | 100/00 % | |
| مهدی حسین پور آقائی | 1 | 100/00 % | |
| Farnoush Toghiany | 21 | 98/36 % | |
| zahra namdari | 46 | 98/21 % | |
| یاسمن محمدی پور | 4 | 98/08 % | |
| Sheida Taheri | 3 | 97/37 % | |
| پژمان همدانی | 3 | 97/37 % | |
| محمدحسین میرزایی | 3 | 97/30 % | |
| Tara Mohammadi | 3 | 96/43 % | |
| yasaman mohamadipur | 51 | 95/86 % | |
| محمدجواد ملائی اردستانی | 3 | 94/44 % | |
| Arzhang Saberi | 4 | 93/33 % | |
| Soheila Karimi | 124 | 92/73 % | |
| aram farhmand | 10 | 92/31 % | |
| یاشار اسکندری | 98 | 91/14 % | |
| الشان مقیمی آذر | 11 | 90/80 % | |
| عباس پورمیدانی | 1 | 90/00 % | |
| پریسا سلوکی شهرضایی | 72 | 89/49 % | |
| ارشیا قلمکاری | 33 | 89/23 % |


