محتوای الکترونیکی
bar Chart Sample

You should spend about 20 minutes on this task.
Write a short report for a university lecturer describing the information shown below.
Write at least 150 words.
Report Plan
Paraphrase: shows>offering the data overview of; production of the world’s oil in OPEC and non-OPEC countries>production of oil in OPEC and non-OPEC countries across the world
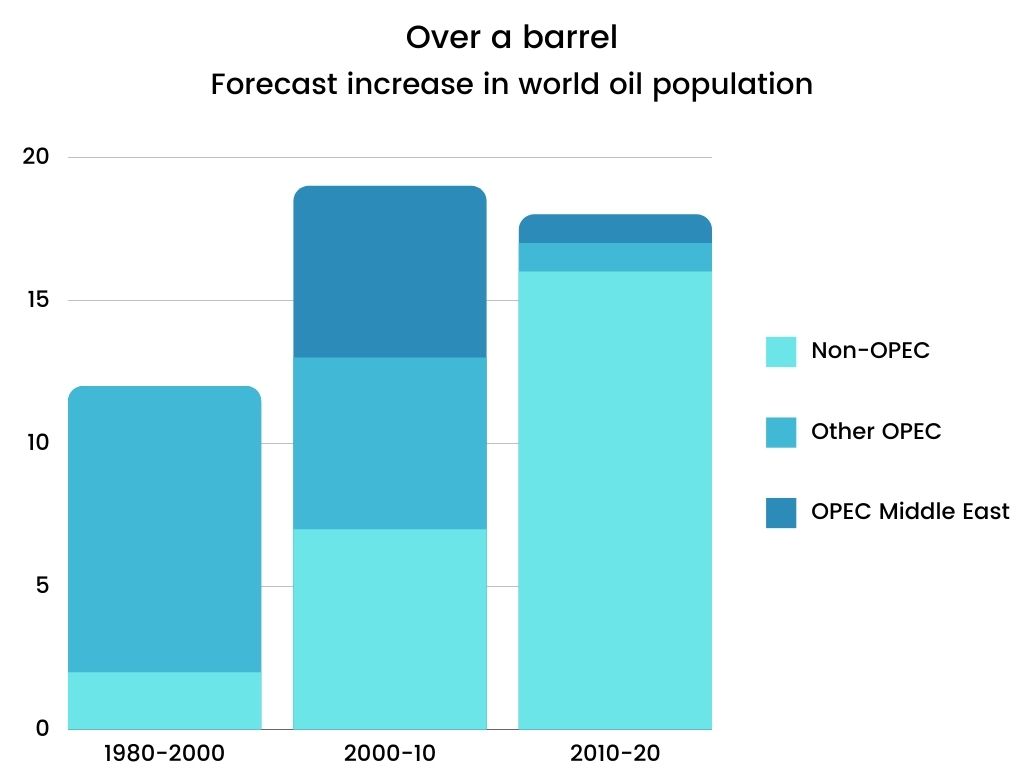
Overview: The graph offers data overview of past, present and future production of oil in OPEC and non-OPEC countries.
Paragraph 2: (1) Talk about the conditions between the time period of 1980 and 2000. Give figures.
Paragraph 3: (1) Talk about future expectations. Give figures.
Sample Answer
The graph is offering the data overview of past, present and future with concern to the production of oil in OPEC and non-OPEC countries across the world. These figures indicate the predictions of oil production. While the number is likely to increase significantly in the Middle Eastern OPEC countries, in others, a fall is foreseen.
Between the time period of 1980 and 2000, most of the world’s oil was sourced from non-OPEC nations. On the contrary, the OPEC countries produced only two million barrels a day. Since then, these figures have considerably changed. And then, between 2000 and 2010, the prediction states the sourcing of 10 million barrels from Middle Eastern OPEC countries and 10 million barrels from non-OPEC or OPEC nations.
Although experts envision the stabilization of oil production between 2010 and 2020, a lot of it is anticipated to come from the Middle Eastern OPEC nations. In terms of other areas, 5 million barrels each day is expected to be sourced.
15 نظر
The supplied bar graph illustrates the comparison of produced oil in OPEC and non-OPEC countries from 1980 up to 2020 over the world. The presented amounts are over a barrel. The provided data are showing a considerable increase in produced oil by OPEC Middle East countries during these years. on the contrary, the amounts related to other countries are declining over time.
the provided bar chart gives information about forecast increase in world oil population condition between the time period of 1980 and 2020. the figures indicate the predictions of oil production. While the number is likely to increase significantly in the Middle Eastern OPEC countries, in others, a fall is foreseen. of the year 2000 to 2010 non-OPEC, other-OPEC,OPEC Middle east simultanesously increased but after that between 2010 to 2020 NON-OPEC increased sharply.
The supplied bar graph illustrates the comparison of produced oil in OPEC and non-OPEC countries from 1980 up to 2020 over the world. The presented amounts are over a barrel. The provided data are showing a considerable increase in produced oil by OPEC Middle East countries during these years. on the contrary, the amounts related to other countries are declining over time.
the given bar graph shows the comparison of the production of oil in OPEC and non-OPEC countries across the world between 2010 and 2020 .In general, These figures indicate the predictions of oil production. While the number is likely to uplift significantly in the Middle Eastern OPEC countries, in others, a fall is foreseen.
The chart gives information on past, present and future with concern to the production of oil in OPEC and non-OPEC countries across the world As is observed, These figures indicate the predictions of oil production. While the number is likely to go up significantly in the Middle Eastern OPEC countries, another , a decline is foreseen.
The chart gives information on past, present and future with concern to the production of oil in OPEC and non-OPEC countries across the world As is observed, These figures indicate the predictions of oil production. While the number is likely to go up significantly in the Middle Eastern OPEC countries, another , a decline is foreseen.
the given bar graph illustrates comparison of the production of oil in OPEC and non-OPEC countries across the world between 2010 and 2020 .
The supplied bar chart illustrates the proportion of manufacture of Oil in OPEC and non-OPEC countries in the world.
the presented chart provides information on oil production in OPEC and non-OPEC countries for three decades
the given bar graph describes informations of past, present and future production of oil in OPEC and non OPEC countries.
the shown bar graph illustrates information on past, present, and future with concern to the production of oil in OPEC and non-OPEC countries across the world.
The bar chart compares the world oil's production among non-opec , other-opec and opec middle east. Overall, the chart depicts that between 1980-2000, majority of oil production associated with other opec group, then among 2000-2010 the production share allocated equally among 3 producer and finally in years of 2010-2020 non-opec covered more that 90 percent of world oil' population as the massive global oil producer.
it is evident that, production of the world's Oil OPEC countries had been increasing during a period 20 years. while, since 2000 trend of Oil production divided equally among producer countries. the prediction states, by the end of 2020, majority of Oil production will have associated with NON-OPEC countries.
the given bar chart indicates the world oil's production in OPEC and non-OPEC countries from the 1980 to 2020 over the world. as is observed, the amount of oil production had been increased in other OPEC before 2000, then the rate of all countries had been steadiness for 10 years, and finally the production has increased rapidly in non-OPEC countries while in others, the fall is witnessed.
Generally, by 2000, other OPEC nations had been providing most of the world's oil, while only one-fifth of oil had been provided by non-OPEC countries. Between 2000 and 2010 oil consumption increased. Therefore, all kinds of producers were equal in generating oil. After 2010, a massive change happened so, as you can see, for 10 years non-OPEC covered most of the oil population.
لطفا وارد شوید و نظر خود را ثبت نمایید.
بهترین ها
| نام | تعداد آزمون | میزان موفقیت | |
|---|---|---|---|
| َAmeneh Darvishzadeh | 1 | 100/00 % | |
| Mehrad Hashemi | 1 | 100/00 % | |
| مهدی حسین پور آقائی | 1 | 100/00 % | |
| Farnoush Toghiany | 21 | 98/36 % | |
| zahra namdari | 46 | 98/21 % | |
| یاسمن محمدی پور | 4 | 98/08 % | |
| Sheida Taheri | 3 | 97/37 % | |
| پژمان همدانی | 3 | 97/37 % | |
| محمدحسین میرزایی | 3 | 97/30 % | |
| Tara Mohammadi | 3 | 96/43 % | |
| yasaman mohamadipur | 51 | 95/86 % | |
| محمدجواد ملائی اردستانی | 3 | 94/44 % | |
| Arzhang Saberi | 4 | 93/33 % | |
| Soheila Karimi | 124 | 92/73 % | |
| aram farhmand | 10 | 92/31 % | |
| یاشار اسکندری | 98 | 91/14 % | |
| الشان مقیمی آذر | 11 | 90/80 % | |
| عباس پورمیدانی | 1 | 90/00 % | |
| پریسا سلوکی شهرضایی | 72 | 89/49 % | |
| ارشیا قلمکاری | 33 | 89/23 % |


