محتوای الکترونیکی
Bar Chart Sample

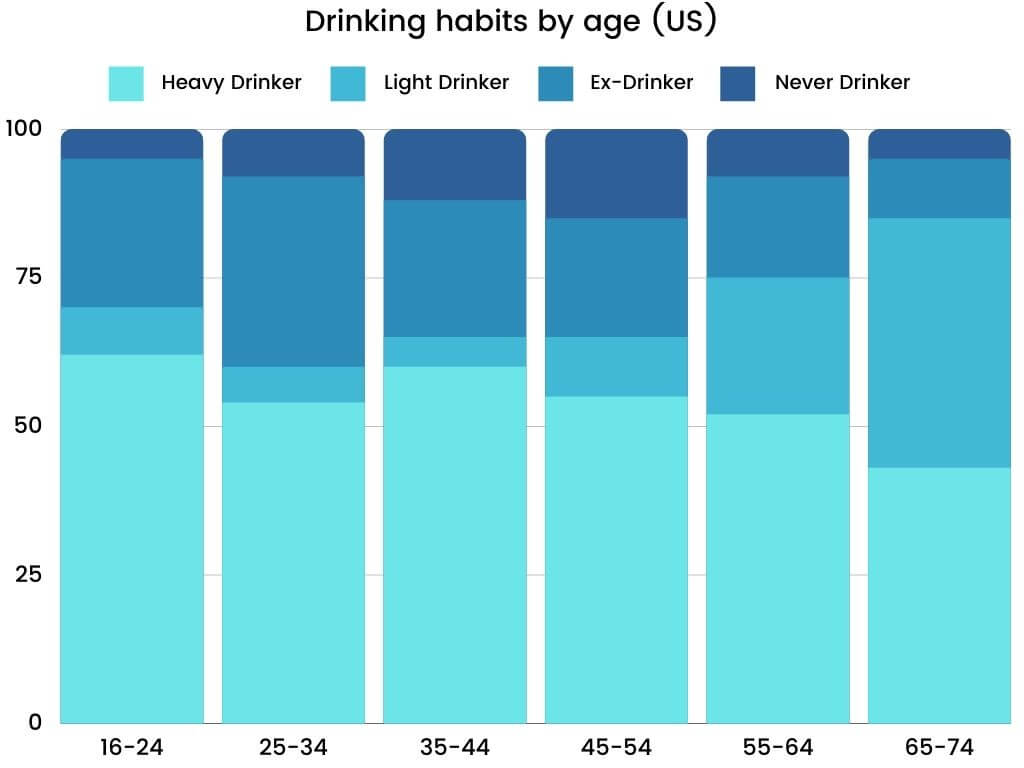
The graph gives information about drinking habits of the US population by age.
Write at least 150 words.
Report Plan
Paraphrase: gives information>outlines; drinking habits of the US population by age>the drinking pattern of Americans based on their age groups
Overview: The bar graph outlines the drinking pattern of Americans based on their age groups.
Paragraph 2: (1) compare drinking patterns in different age groups. Give figures.
Paragraph 3: (1) compare drinking patterns in remaining age groups. Give figures.
Paragraph 4: (1) talk about the age group with highest drinking pattern. Give figures.
Sample Answer
The given bar graph outlines the drinking pattern of Americans based on their age groups. As evident, the drinking habits of US citizens markedly vary based on their age groups. It is seen that the elderly population, majorly those who are above 65 years of age, generally abstain from this addiction.
As per the diagram, 60% of Americans between 16 to 24 years of age have never drunk, while about 10% of them used to drink but now abstain from it. Approximately one-quarter of these youngsters are light-drinkers, and the remaining 5% are heavy on the alcohol. An indistinguishable pattern can be discerned among the age group of 25-34 years. However, the ratio of irregular drinkers has increased, and nearly 8% are hard drinkers.
It is also interesting to note that chronic alcoholics in the country cover the age group of 35-54 years and this ratio is seemingly lower among senior and younger citizens. With an increase in age, the rate of people who never had alcohol declines considerably. Also, a reverse trend can be observed for the ex-drinkers, whose number goes higher as people get older.
The highest ratio of those who are hard drinkers falls between the age group of 45-54 years. On the other hand, the light drinkers cover the highest among the age group of 25-34 years of US citizens. At last, an enormous number of Americans, which is almost 40%, have quit drinking once past 64 years of age.
12 نظر
presented illustration shows data about the compression of the drinking pattern of Americans based on their age groups It is seen that the elderly population,in this bar chart compared five drinking pattern like heavy drinker ,light drinker,ex drinker,and never drinker . in general,heavy-drinker all the time In comparison, the rest of the cases always accounted for a significant portion.
The presented graph compares the proportion of drinking habits among the US individuals with age categories. the defined traits are qualitative including Heavy drinker, Light drinker, Ex-drinker, and never drinker. As is presented, a downward trend in heavy drinking by increasing age exists. While this tendency is rising toward light drinking with age.
The presented graph compares the proportion of drinking habits among the US individuals with age categories. the defined traits are qualitative including Heavy drinker, Light drinker, Ex-drinker, and never drinker. As is presented, a downward trend in heavy drinking by increasing age exists. While this tendency is rising toward light drinking with age.
The chart gives information on drinking habits of the US population by age, As is observed, the drinking habits of US based on their age groups elderly population, majorly those who are above 65 years of age They generally avoid this addiction.
the presented par graph compares the drinking habits at the age of 16 to 74.As you can see, the highest levels of heavy drinking are between the ages of 55 and 64.
The given bar chart gives information on drinking habits of the US population by age.
According to these statistics, people who were heavy drinkers in their youth reduce this habit as they get older and become light drinkers.
The presented bar chart figures the comparison of the drinking pattern of Americans based on their age groups.
the given bar chart shows the information on drinking habits in different life periods.
the line graph presents data on drinking pattern of americans based on their ages between 16 to 74 years old.
the supplied figure depicts data on the drinking pattern of Americans based on their age groups.
The shown graph present information about drinking habits of the US population between age 16 to 74.
لطفا وارد شوید و نظر خود را ثبت نمایید.
بهترین ها
| نام | تعداد آزمون | میزان موفقیت | |
|---|---|---|---|
| َAmeneh Darvishzadeh | 1 | 100/00 % | |
| Mehrad Hashemi | 1 | 100/00 % | |
| مهدی حسین پور آقائی | 1 | 100/00 % | |
| Farnoush Toghiany | 21 | 98/36 % | |
| zahra namdari | 46 | 98/21 % | |
| یاسمن محمدی پور | 4 | 98/08 % | |
| Sheida Taheri | 3 | 97/37 % | |
| پژمان همدانی | 3 | 97/37 % | |
| محمدحسین میرزایی | 3 | 97/30 % | |
| Tara Mohammadi | 3 | 96/43 % | |
| yasaman mohamadipur | 51 | 95/86 % | |
| محمدجواد ملائی اردستانی | 3 | 94/44 % | |
| Arzhang Saberi | 4 | 93/33 % | |
| Soheila Karimi | 124 | 92/73 % | |
| aram farhmand | 10 | 92/31 % | |
| یاشار اسکندری | 98 | 91/14 % | |
| الشان مقیمی آذر | 11 | 90/80 % | |
| عباس پورمیدانی | 1 | 90/00 % | |
| پریسا سلوکی شهرضایی | 72 | 89/49 % | |
| ارشیا قلمکاری | 33 | 89/23 % |


