محتوای الکترونیکی
Bar Chart Sample

You should spend about 20 minutes on this task.
Summarise the information by selecting and reporting the main features, and make comparisons where relevant.
Write at least 150 words.
Report Plan
Paraphrase: gives information>compares; information about global population percentages and distribution of wealth by region>the population shares in a gamut of regions worldwide with the wealth distribution in these same regions Overview: Compare the population shares in different regions worldwide with the wealth distribution. Paragraph 2: (1) compare different countries and their wealth distribution. Give figures. Paragraph 3: (1) compare the remaining countries and their wealth distribution. Give figures. Paragraph 4: (1) give the overall summary and talk about the trend.
Sample Answer
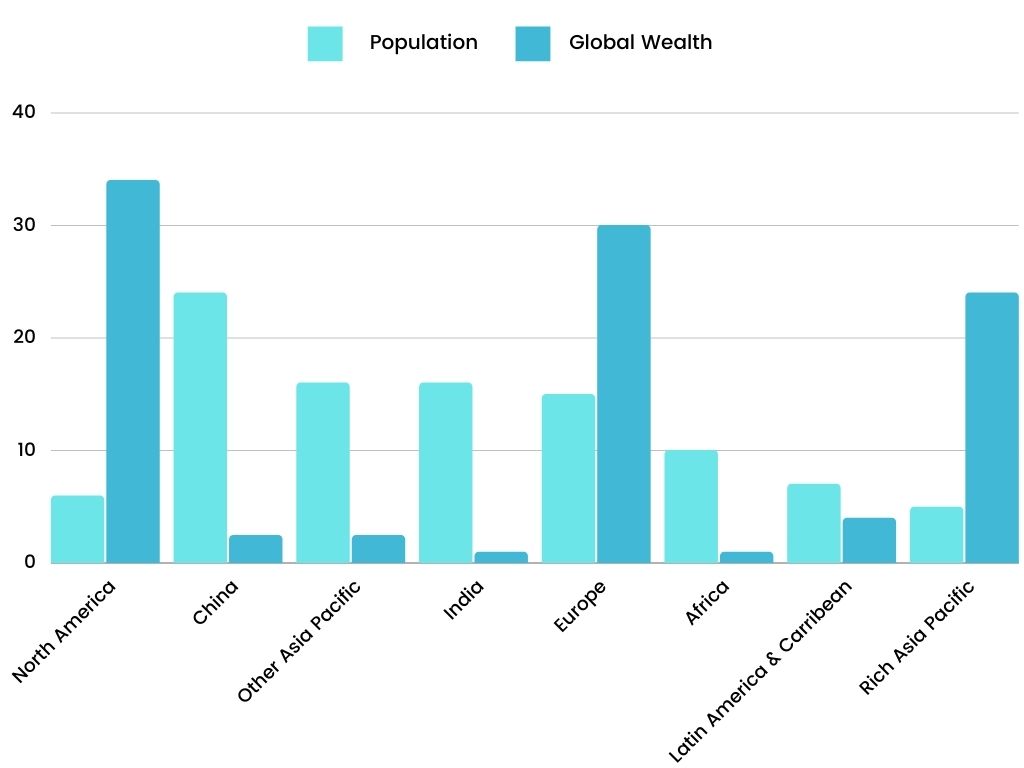
The above-given chart compares the population shares in a gamut of regions worldwide with the wealth distribution in these same regions. It is evident that wealth is heavily concentrated in Europe, North America, and high-income Asia-Pacific nations, which accounts for approximately 90% of global wealth.
Despite having around 6% of the world’s population, North America still boasts nearly 34% of the global wealth. An akin situation can be noticed in Europe, contributing 30% to the global wealth, even though its population is merely 15%. In terms of high-income Asia-Pacific nations, which have 5% of the worldwide population, the world gets 24% of its wealth.
In contrast, the all-inclusive share of wealth owned by people residing in India, China, Africa and other low-income nations in Asia is significantly less than their share of the population. Sometimes, it also goes down by a factor of more than ten. The situation is quite striking in India, where the population is 16% of the world, but the wealth is meagerly 1%. On the other hand, in China, which has the highest global population (24%), the wealth contribution is only 3%.
Overall, the statistics of the world population seem to be inverse in proportion to wealth distribution. If the former is higher, the latter is possibly lower.
8 نظر
the given figure represents information on global population percentages and distribution of wealth by region>the population shares in a gamut of regions worldwide with the wealth distribution in these same regions. in genaral that wealth is heavily concentrated in Europe, North America, and high-income Asia-Pacific nations, which accounts for approximately 90% of global wealth.
the shown bar chart below peresents a comparison between population and global wealth in several regions of the world.
The presented bar chart compares the amount of global wealth with the amount of population in different regions of the world .
According this chart, it is clear that the population is not formed according to the world wealth and in many countries the statistics of the population and the world wealth are very opposite to each other. America has the most wealth in the world, while China has the largest population.
The supplied bar chart depicts the proportion of population with amount of global wealth in several zones.
The provided figure depicts a comparison between global wealth and population in several regions
the provided bar graph gives a comparison between population and global wealth among different regions in the world.
the provided diagram gives the amount of the population shares in a gamut of regions worldwide with the wealth distribution in these same regions.
لطفا وارد شوید و نظر خود را ثبت نمایید.
بهترین ها
| نام | تعداد آزمون | میزان موفقیت | |
|---|---|---|---|
| َAmeneh Darvishzadeh | 1 | 100/00 % | |
| Mehrad Hashemi | 1 | 100/00 % | |
| مهدی حسین پور آقائی | 1 | 100/00 % | |
| Farnoush Toghiany | 21 | 98/36 % | |
| zahra namdari | 46 | 98/21 % | |
| یاسمن محمدی پور | 4 | 98/08 % | |
| Sheida Taheri | 3 | 97/37 % | |
| پژمان همدانی | 3 | 97/37 % | |
| محمدحسین میرزایی | 3 | 97/30 % | |
| Tara Mohammadi | 3 | 96/43 % | |
| yasaman mohamadipur | 51 | 95/86 % | |
| محمدجواد ملائی اردستانی | 3 | 94/44 % | |
| Arzhang Saberi | 4 | 93/33 % | |
| Soheila Karimi | 124 | 92/73 % | |
| aram farhmand | 10 | 92/31 % | |
| یاشار اسکندری | 98 | 91/14 % | |
| الشان مقیمی آذر | 11 | 90/80 % | |
| عباس پورمیدانی | 1 | 90/00 % | |
| پریسا سلوکی شهرضایی | 72 | 89/49 % | |
| ارشیا قلمکاری | 33 | 89/23 % |


