محتوای الکترونیکی
Bar Chart Sample
You should spend about 20 minutes on this task.
Describe the information shown to a university or college lecturer.
Write at least 150 words
Report Plan
Paraphrase: show>demarcates; hours worked and stress levels amongst professionals>working hours of eight categories of professionals and the percentages of those dealing with stress-related issues
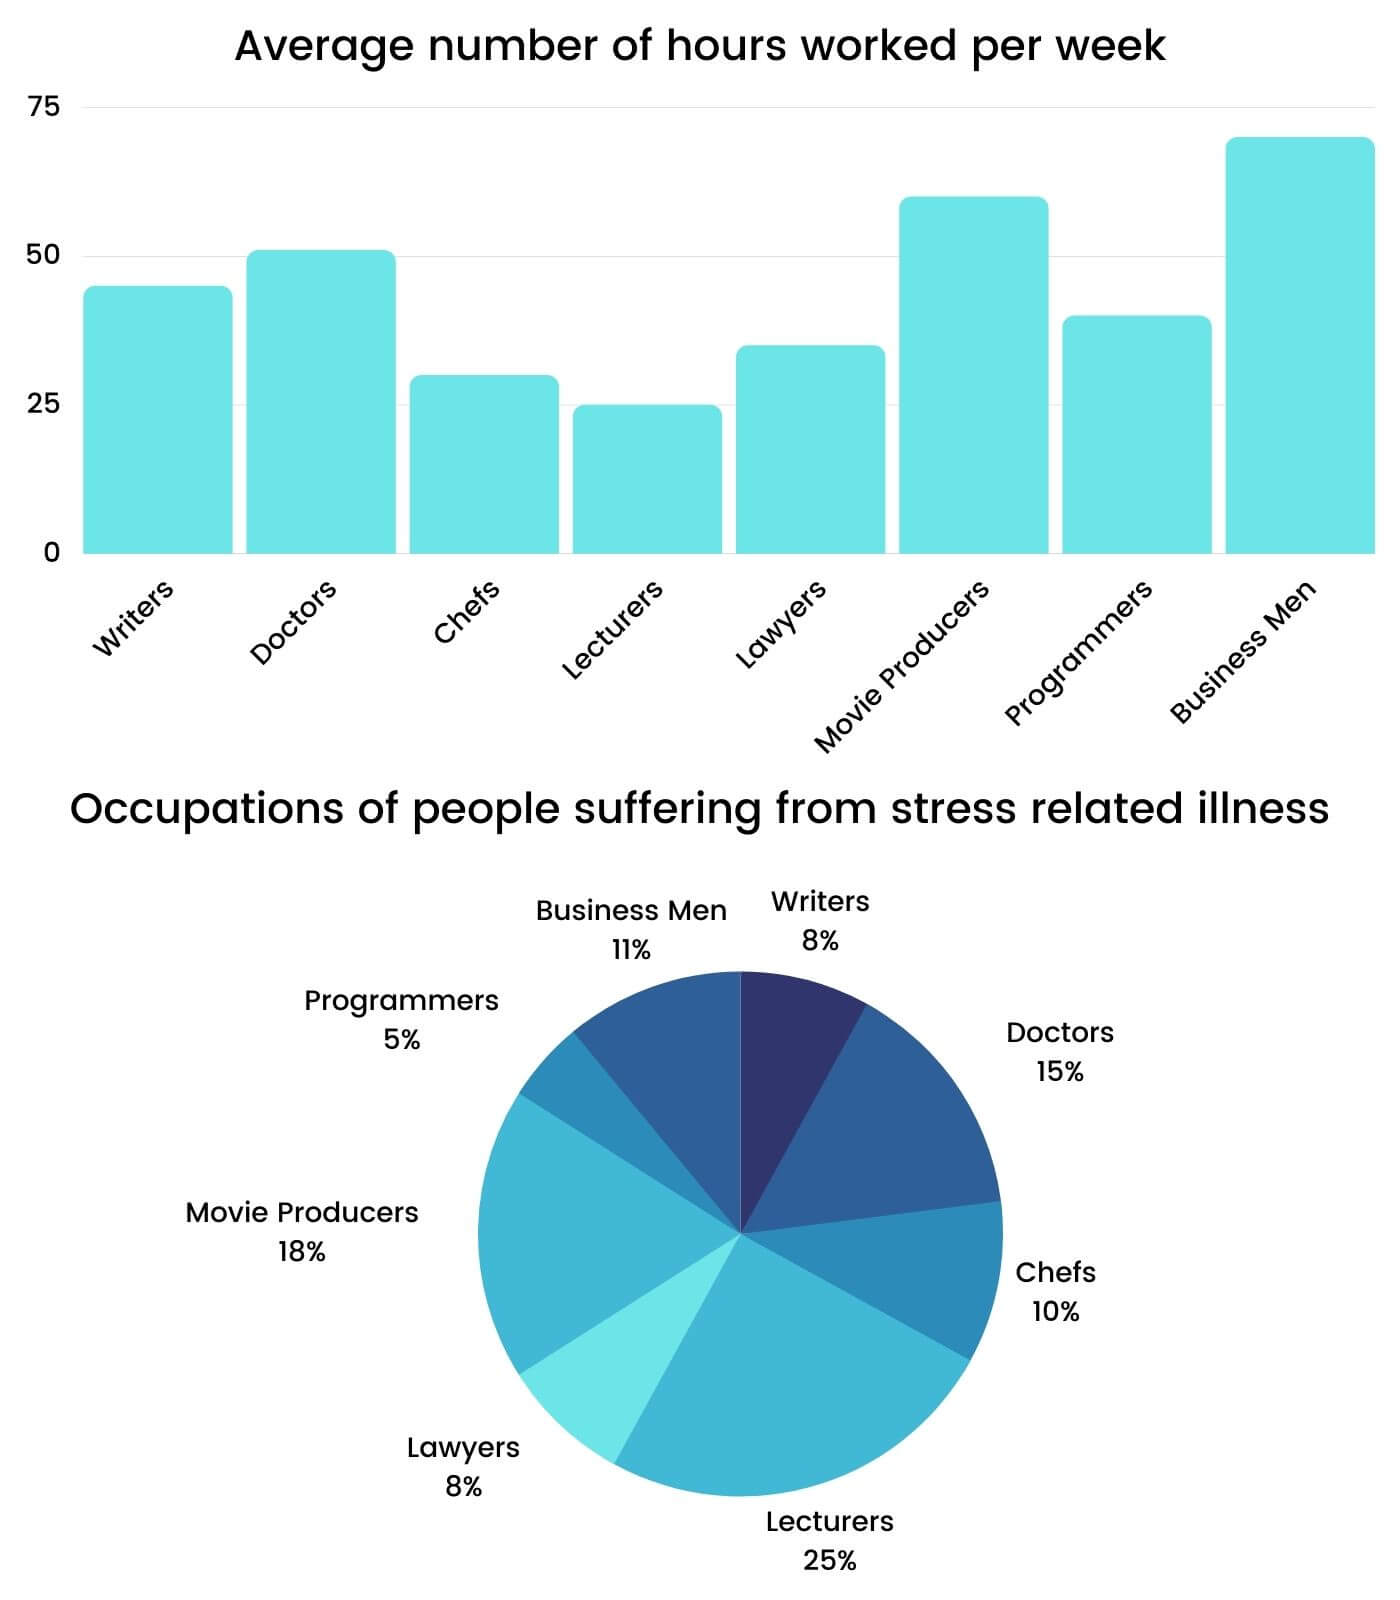
Overview: The given illustration shows the average working hours of eight categories of professionals and the percentages of those dealing with stress-related issues.
Paragraph 2: (1) compare the number of hours professionals work and their stress-related issues. Give figures.
Sample Answer
The given illustration demarcates the average working hours of eight categories of professionals and the percentages of those dealing with stress-related issues. The overview states that business owners have lesser anxiety issues, despite working for extended hours. On the other hands, teachers who work for a specific number of hours a day have the highest anxiety issues.
As per the statistics, businessmen work nearly 70 hours a week, which is higher than other professionals. Even though the professional engagement is longer, their work-stress percentage is lower, precisely 11%. Movie producers and doctors both have working hours exceeding 10 hours a day, and their illness percentage from work pressure accounts for 18% and 15%, respectively. Writers and programmers have significantly lesser stress issues despite more office duration than chefs, who work nearly 30 hours each week, constituting 10% of patients with stress-related problems. It should be noticed that one in four lecturers are dealing with stress-related sickness, despite their working hours being the lowest in a week, which is merely 25 hours. This states that stress illness from professional engagement is not directly proportional to the working hours.
7 نظر
The provided bar chart shows the difference between the amount of working hours between different occupations and the extent of their involvement with stress .
Generally, as it is obvious the most working hours belong to bussiness men and lecturers have assigned the least proportion of working hours to themselves. However, lecturers exprience highest levels of stress and programmers have the lowest.
The given bar chart illustrates the amount of hours work in eight groups of occupations and the pie chart compares the proportion of stress rate in these categories.
the diagrams compare the hours of working in eight different jobs and their correlation with the amount of stress
shown bar graph gives data on the average of working hours of eight categories of professionals and the percentages of those dealing stress-related issues.
the supplied bar graph presents information about the average working hours of eight categories of professionals and the percentages of those dealing with stress-related issues.
the graph depicts relation between working hours and stress level among eight selected career.
لطفا وارد شوید و نظر خود را ثبت نمایید.
بهترین ها
| نام | تعداد آزمون | میزان موفقیت | |
|---|---|---|---|
| َAmeneh Darvishzadeh | 1 | 100/00 % | |
| Mehrad Hashemi | 1 | 100/00 % | |
| مهدی حسین پور آقائی | 1 | 100/00 % | |
| Farnoush Toghiany | 21 | 98/36 % | |
| zahra namdari | 46 | 98/21 % | |
| یاسمن محمدی پور | 4 | 98/08 % | |
| Sheida Taheri | 3 | 97/37 % | |
| پژمان همدانی | 3 | 97/37 % | |
| محمدحسین میرزایی | 3 | 97/30 % | |
| Tara Mohammadi | 3 | 96/43 % | |
| yasaman mohamadipur | 51 | 95/86 % | |
| محمدجواد ملائی اردستانی | 3 | 94/44 % | |
| Arzhang Saberi | 4 | 93/33 % | |
| Soheila Karimi | 124 | 92/73 % | |
| aram farhmand | 10 | 92/31 % | |
| یاشار اسکندری | 98 | 91/14 % | |
| الشان مقیمی آذر | 11 | 90/80 % | |
| عباس پورمیدانی | 1 | 90/00 % | |
| پریسا سلوکی شهرضایی | 72 | 89/49 % | |
| ارشیا قلمکاری | 33 | 89/23 % |


