محتوای الکترونیکی
Bar Chart Sample

You should spend about 20 minutes on this task.
Summarise the information by selecting and reporting the main features, and make comparisons where relevant.
Write at least 150 words.

Report Plan
Paraphrase: showss>signifies; changes>estimated comparison
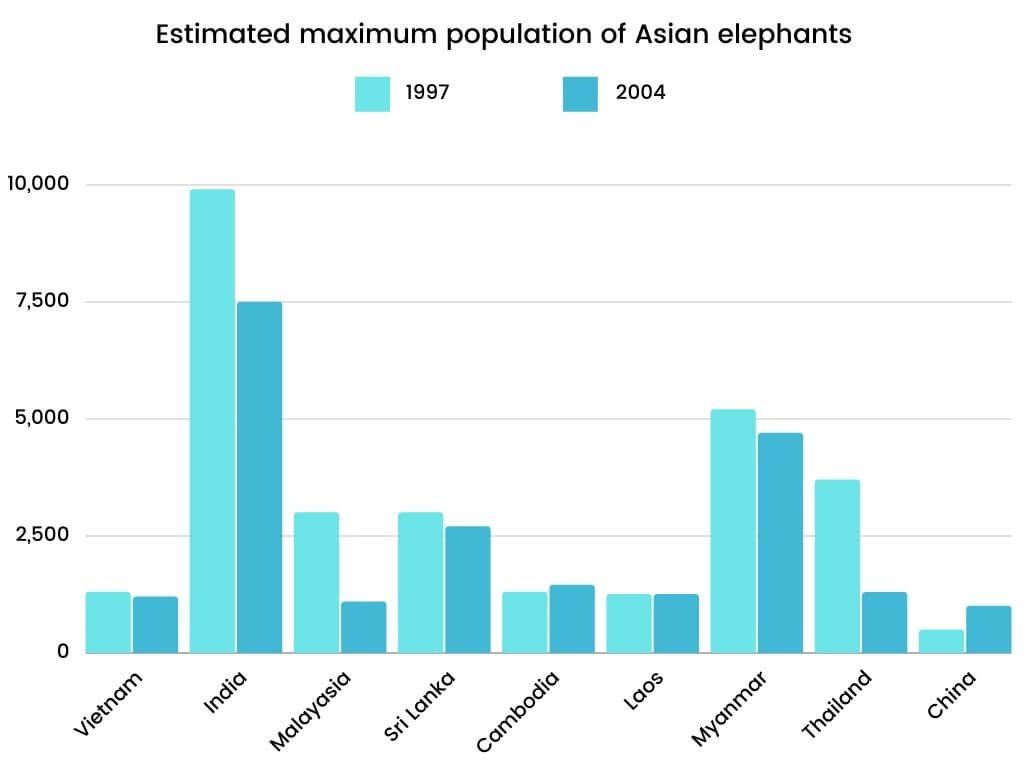
Overview: The graph signifies the estimated comparison between the years 1994 and 2004.
Paragraph 2: (1) compare elephant population in cities. Then compare the upsurge or downtrend. Give figures.
Paragraph 3: (1) compare elephant population in cities. Then compare the stable or positive trend. Give figures.
Sample Answer
The graph signifies the estimated comparison between the years 1994 and 2004 while evaluating the maximum population of elephants in Asian countries.
In the graph, we can see a sharp decline in most of the countries. However, this decrease was more noticeable in Thailand and Malaysia, where the number of elephants was considered to be less than half the figure showed in 1997. Also, in Malaysia, the number of elephants dropped to as low as 1000. Although India remained a country with the largest population of this mammal, the numbers saw a significant fall in 2004 when the count was only 7500. Despite the size, China had a small population of nearly 500 elephants in 2004.
3 نظر
the shown bar chart gives information on the comparison population in Asian countries over the period of 10 years.
Overal, india have had the highest population of asian elephants between 1997- 2004 and china have assigned the lowest number of that compered to other countries. except china and cambodia that have had an increasing in elephant population and also laos that number of elephant has remained stead, in most countries we are witnessing a decreasing trend.
In general, the popu;ation in some Asian countries, such as Vietnam, Sri Lanka, Cambodia and Laos remained almost constant in 1994 and 2004, but it seems that the population in the countries of India, Malaysia, Myanmar and Thailand has been facing a decline, which in India and Thailand is more impressive.in addition the increae in population in China can be seen in 2004.
لطفا وارد شوید و نظر خود را ثبت نمایید.
بهترین ها
| نام | تعداد آزمون | میزان موفقیت | |
|---|---|---|---|
| َAmeneh Darvishzadeh | 1 | 100/00 % | |
| Mehrad Hashemi | 1 | 100/00 % | |
| مهدی حسین پور آقائی | 1 | 100/00 % | |
| Farnoush Toghiany | 21 | 98/36 % | |
| zahra namdari | 46 | 98/21 % | |
| یاسمن محمدی پور | 4 | 98/08 % | |
| Sheida Taheri | 3 | 97/37 % | |
| پژمان همدانی | 3 | 97/37 % | |
| محمدحسین میرزایی | 3 | 97/30 % | |
| Tara Mohammadi | 3 | 96/43 % | |
| yasaman mohamadipur | 51 | 95/86 % | |
| محمدجواد ملائی اردستانی | 3 | 94/44 % | |
| Arzhang Saberi | 4 | 93/33 % | |
| Soheila Karimi | 124 | 92/73 % | |
| aram farhmand | 10 | 92/31 % | |
| یاشار اسکندری | 98 | 91/14 % | |
| الشان مقیمی آذر | 11 | 90/80 % | |
| عباس پورمیدانی | 1 | 90/00 % | |
| پریسا سلوکی شهرضایی | 72 | 89/49 % | |
| ارشیا قلمکاری | 33 | 89/23 % |


