محتوای الکترونیکی
Bar Chart Sample

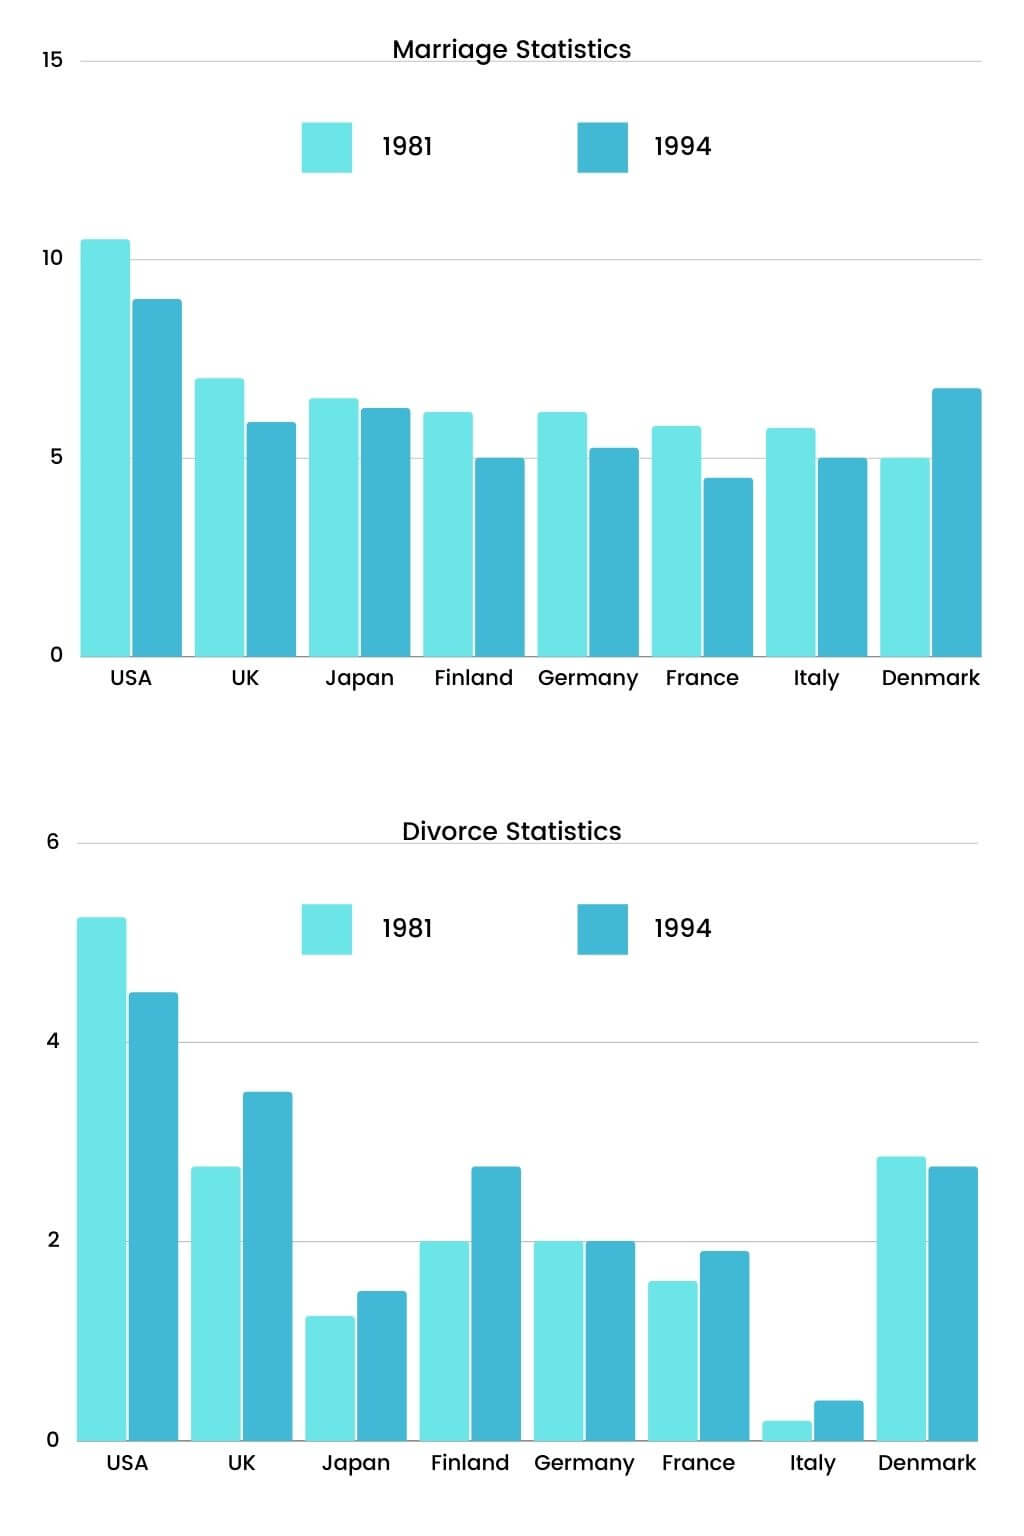
The bar charts below show the Marriage and Divorce Statistics for eight countries in 1981 and 1994.
Write at least 150 words.
Report Plan
Sample Answer
The bar graphs are representing the total number of marriages and divorces in eight varying countries throughout the period of 1981 and 1994. The surveyed nations include the USA, Japan, UK, Germany, Finland, Denmark, Italy and France. As it can be clearly seen in the chart, the rate of marriages in all of the nations, excluding Denmark, had a sharp decline over the period of survey. However, there seems to be a rise in total divorce cases.
The bar chart represents that the marriage rate in 1981 in the US was the highest in comparison to other nations, which was exceeding 10 per thousand. On the contrary, in 1994, this number declined to 9 per thousand people. In other European nations, including Italy, Denmark, Finland, France and the United Kingdom, the marriage rate was approximately 6 for every thousand people. In 1981, standing at 5 per thousand, Denmark recorded the lowest number of marriages. The graph also shows that post 15 years, the marriage rate fell further in most of the countries. However, in Denmark, the number saw an increase, which was nearly 2 per thousand.
In 1981, Germany and Finland recorded almost the same rate, a little more than 6 per thousand. Still, a significant drop was recorded in both these nations. In Finland, the marriage rate declined to a little more than 4 per thousand in 1994 and it was closer to 6 in Germany during the same time.
Also, from the divorce statistics, it is clear that the maximum rate of divorce was seen in the USA, which was a bit over 5 per thousand in 1981. The divorce rate of 1994 was compared to the marriage rate of 1981 in all of the countries, including Denmark and the USA. The lowest number of divorce rate was registered in Italy among others. Germany showed stability for 2 years. And then, the divorce rate per thousand increased a bit from less than 3 per thousand in 1981 to more than 3 in 1994.
بهترین ها
| نام | تعداد آزمون | میزان موفقیت | |
|---|---|---|---|
| َAmeneh Darvishzadeh | 1 | 100/00 % | |
| Mehrad Hashemi | 1 | 100/00 % | |
| مهدی حسین پور آقائی | 1 | 100/00 % | |
| Farnoush Toghiany | 21 | 98/36 % | |
| zahra namdari | 46 | 98/21 % | |
| یاسمن محمدی پور | 4 | 98/08 % | |
| Sheida Taheri | 3 | 97/37 % | |
| پژمان همدانی | 3 | 97/37 % | |
| محمدحسین میرزایی | 3 | 97/30 % | |
| Tara Mohammadi | 3 | 96/43 % | |
| yasaman mohamadipur | 51 | 95/86 % | |
| محمدجواد ملائی اردستانی | 3 | 94/44 % | |
| Arzhang Saberi | 4 | 93/33 % | |
| Soheila Karimi | 124 | 92/73 % | |
| aram farhmand | 10 | 92/31 % | |
| یاشار اسکندری | 98 | 91/14 % | |
| الشان مقیمی آذر | 11 | 90/80 % | |
| عباس پورمیدانی | 1 | 90/00 % | |
| پریسا سلوکی شهرضایی | 72 | 89/49 % | |
| ارشیا قلمکاری | 33 | 89/23 % |


