محتوای الکترونیکی
Line Graph Sample

Report Plan
Paraphrase: shows>provides information; price changes for>changes in the price of
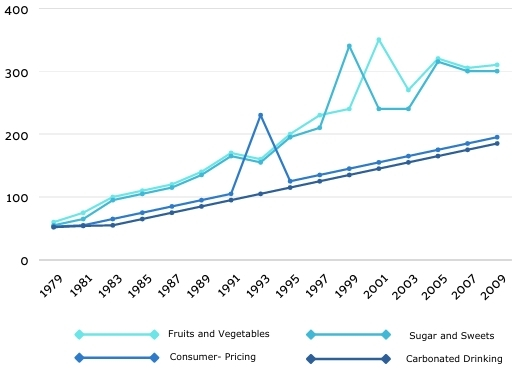
Overview: The line graph provides information about changes in price of three different food product groups in the USA from 1979 to 2009.
Paragraph 2: (1) Talk about the overall picture. Give a gist of the graph.
Paragraph 3: (1) Talk about price changes. Give figures.
Paragraph 4: (1) Talk about price changes. Give figures.
Sample Answer
The line graph provides information about changes in the price of three different food product groups in the USA from 1979 to 2009 and the overall trend in the consumer price index over these 30 years.
Overall, it is clear that prices increased for the three food product groups, despite fluctuations. At a glance, an increase in the prices for fresh fruits and vegetables was significantly higher than the rise in the general consumer price index.
All the lines on the graph have the same starting figure in 1979. Over the period, the consumer price index rose steadily from around 60 in 1979 to over 200 in 2009. Prices for sugar and sweets and carbonated drinks showed similar trends. Although their prices also rose, they were consistently below the consumer price index average after 1987. After many minor fluctuations, the number for sugar and sweets was 200 on the graph in 2009, higher than the final figure for carbonated drinks at 150.
Prices rose sharply for fresh fruits and vegetables, particularly after 1989. From the same figure of about 60 at the start of the period, the prices finished at roughly 330 on the index in 2009.
23 نظر
The given polyline graph represents the relevant alterations in the price for fresh fruits and vegetables, sugar and sweets, and carbonated drinking from 1979 up to 2009. Additionally, the overall trend in the consumer-pricing items is indicated in the years given. Generally speaking, all of the prices are going up over time. Moreover, the prices of fruits and vegetables, as well as sugar and sweets, are extremally accelerating rather than other indexes.
the line graph illustrates information about changes in the price of three different food product groups in USA over the priod of time 31 years.
Presented line graph illustrates data on changing the price of the fresh fruits and vegetables, sugar and sweets, and carbonated drinking from 1979 up to 2009 .
the shown line graph shows information on relative price changes for fresh fruits and vegetables ,sugar and sweets. generally speaking in this case of three product are increased , in the other hand the highest price are sugar and sweets ,fruits and vegetables.in addition the lowest price is carbonated drinking.
As it is clear , all four products have experienced rampant inflation and the prices have increased. The highest price for fruits and vegetables is in 1999, while the highest price in the sweetmeat is related to two years later,2001.
The provided line graph illustrated the differences price for three various food product groups in USA from 1979 to 2009.
The given line graph shows data about (the comparison of) three different food product groups' prices between 1978 and 2009.
the given line graph illustrates the relative price changes for fresh fruits and vegetables, suger and carbonated drinks during 31 years.
the provided data gives information on changes in the price of three different food product groups in the USA from 1979 to 2009 and the overall trend in the consumer price index over these 30 years.
As is observed, there is an upward trend in three category of food and consumer-pricing despite fluctuation, but an increase in prices of carbonated Drinking was slightly than other three trends.
as is observed, all lines on the graph uplift gradually till 1991 and consumer-pricing, fruits and vegetables, sugar and sweets have vacillated afterward but carbonated drinking continues progressive rise.
as is observed, all lines on the graph uplift gradually till 1991 and consumer-pricing, fruits and vegetables, sugar and sweets have vacillated afterward but carbonated drinking continues progressive rise.
The graph illustrates the intake of different type of spreads (fresh fruits and vegetables, sugar and sweets and carbonated drinking) between the years 1979 to 2009.The graph also shows the general trend in the consumer price index during this time. Overall, the consumer price index showed a slow and steady increase from 1979 to 2009.However, the fresh fruits and vegetables, sugar and sweets is higher than customer price index. In general, the price of all three categories is raised between 1979 and 2009.
The line graph illustrates changes in the prices of food items (fruits and vegetables, sugars and sweets, carbonated drinks) in the US within a length of 30 years, while also showing how consumer pricing increased or decreased over time. Overall, fruits and vegetables had the highest cost, with carbonated drinks had the lowest. There was also a general increase in the prices over the years. In 1979, the prices of all product groups and consumer price index were almost the same. The figure for carbonated drinking showed parallel with the consumer price index, except for the years between 1991 and 1995. By 1993, the carbonated drinking price reached its highest rate, however the two product groups fell down dramatically. The prices for fresh fruits and vegetables rose sharply.
The supplied line graph presents information about the comparison of price changes for three different food product groups such as fresh food and vegetables, sugar and sweets and carbonated drinking in USA from 1979 to 2009. As is observed there is an upward trend for three different food categories and consumer pricing had fluctuation. Fresh food and vegetable experienced the highest cost toward sugar and sweets, and carbonated drinking.
The supplied line graph presents information about the comparison of price changes for three different food product groups such as fresh food and vegetables, sugar and sweets and carbonated drinking in USA from 1979 to 2009. As is observed there is an upward trend for three different food categories and consumer pricing had fluctuation. Fresh food and vegetable experienced the highest cost toward sugar and sweets, and carbonated drinking.
The provided diagram shows data on relative price changes for fresh fruits and vegetables, sugars and sweets, and carbonated drinks between 1978 and 2009. In general, it is clear that prices upsurged for the three food product groups, despite fluctuations. At a glance, an upsurge in the prices for fresh fruits and vegetables was significantly higher than the rise in the general consumer price index. All the lines on the graph have the same starting figure in 1979. Over the period, the consumer price index rose steadily from around 60 in 1979 to over 200 in 2009. Prices for sugar and sweets and carbonated drinks showed similar trends. Although their prices also rose, they were consistently below the consumer price index average after 1987. After many minor fluctuations, the number for sugar and sweets was 200 on the graph in 2009, higher than the final figure for carbonated drinks at 150. Prices rose sharply for fresh fruits and vegetables, particularly after 1989. From the same figure of about 60 at the start of the period, the prices finished at roughly 330 on the index in 2009.
The provided diagram shows data on relative price changes for fresh fruits and vegetables, sugars and sweets, and carbonated drinks between 1978 and 2009. In general, it is clear that prices upsurged for the three food product groups, despite fluctuations. At a glance, an upsurge in the prices for fresh fruits and vegetables was significantly higher than the rise in the general consumer price index. All the lines on the graph have the same starting figure in 1979. Over the period, the consumer price index rose steadily from around 60 in 1979 to over 200 in 2009. Prices for sugar and sweets and carbonated drinks showed similar trends. Although their prices also rose, they were consistently below the consumer price index average after 1987. After many minor fluctuations, the number for sugar and sweets was 200 on the graph in 2009, higher than the final figure for carbonated drinks at 150. Prices rose sharply for fresh fruits and vegetables, particularly after 1989. From the same figure of about 60 at the start of the period, the prices finished at roughly 330 on the index in 2009.
The presented graph gives information about relative price changes for fresh fruits and vegetables, sugars and sweets, and carbonated drinks between 1979 and 2009 and the overall trend in the consumer price index over these 30 years. In common, it is clear that prices rise for the three food product groups, despite fluctuations. At a glance, a climb in the prices for fresh fruits and vegetables was significantly higher than the uplift in carbonated drinks.
The given line graphs compare data on changes in the price of some items over 31 years, which I will discuss in detail. As is observed, all four items' trends increased, despite fluctuations. All these items started at the same point, but two of these graphs rocketed faster during the mentioned time.
the given line chart illustrates the comparison of relative price converts between 3 different food product groups in USA and the line graph consists fresh fruits and vegetables, sugars and sweets, and carbonated drinks over 30 years. as is presented, it is clear that prices uplift for three food product groups, despite flucttuations. at a stare, the prices of fresh fruits and vegetables rose dramatically and carbonated drinks had a slightly upward trend.
supplied illustration depicts fluctuations of the price of three commodities in a 31-year period.
The accompanying line graph is a representative of price fluctuation for various goods in the USA during a 31 years.
لطفا وارد شوید و نظر خود را ثبت نمایید.
بهترین ها
| نام | تعداد آزمون | میزان موفقیت | |
|---|---|---|---|
| َAmeneh Darvishzadeh | 1 | 100/00 % | |
| Mehrad Hashemi | 1 | 100/00 % | |
| مهدی حسین پور آقائی | 1 | 100/00 % | |
| Farnoush Toghiany | 21 | 98/36 % | |
| zahra namdari | 46 | 98/21 % | |
| یاسمن محمدی پور | 4 | 98/08 % | |
| Sheida Taheri | 3 | 97/37 % | |
| پژمان همدانی | 3 | 97/37 % | |
| محمدحسین میرزایی | 3 | 97/30 % | |
| Tara Mohammadi | 3 | 96/43 % | |
| yasaman mohamadipur | 51 | 95/86 % | |
| محمدجواد ملائی اردستانی | 3 | 94/44 % | |
| Arzhang Saberi | 4 | 93/33 % | |
| Soheila Karimi | 124 | 92/73 % | |
| aram farhmand | 10 | 92/31 % | |
| یاشار اسکندری | 98 | 91/14 % | |
| الشان مقیمی آذر | 11 | 90/80 % | |
| عباس پورمیدانی | 1 | 90/00 % | |
| پریسا سلوکی شهرضایی | 72 | 89/49 % | |
| ارشیا قلمکاری | 33 | 89/23 % |


