محتوای الکترونیکی
Line Graph Sample
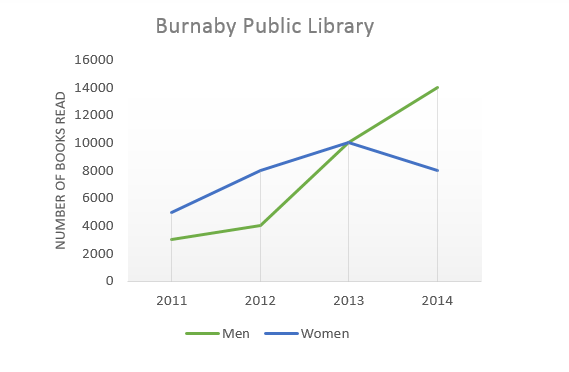
The graph below shows the number of books read by men and women at Burnaby Public Library from 2011 to 2014.
Summarise the information by selecting and reporting the main features, and make comparisons where relevant.
Sample Answer
The graph shows us the number of books read at the Burnaby Public Library by men and women during the four years of 2011 to 2014.
As the graph shows us, there is a reasonable difference between the men and women, with the number of books read by men on a steady increase during this period, while the number of books read by women was on the rise till 2013, after which it was on a decline.
Vocabulary
- Reasonable difference between
- On the rise
- On a decline
- This period started though
- On a steady increase
- Dropped down
31 نظر
The graph compares the men and women in terms of the number of books that they read in Burnaby library over a period of 3 years from 2001 to 2016. Overall, while the number of books read by men had an upward trend during the period, the figure for women fluctuated. In 2001, as it can be seen, about 5000 books were read by women, while the figure for men was lower at approximately 3000 books. Between 2011 and 2013, although the women read more books, the figures for both men and women seem to have had an increase. The number of books read by women, after peaking at 10000 books in 2013, steadily fell to about 7000 books in 2014. In contrast the figure for men had a different trend at the same time, and rose rapidly stood at 14000 in at the end of period. 2013 marks the point at which the number of books read by men overtook that for the women.
The provided line graph illustrates data about how many books read by men and women at the Burnaby public library between 2011 and 2014. Generaly speakin, overal trend for the period is on an
The provided line graph illustrates data about how many books read by men and women at Burnaby library public between 2011and 2014. Generally speaking, overall trend for the period is on an increase in the number of books, who read by men and women. In 2011, while women seems to have had the lowest ratio, the figure for men had the lowest, and was about 2500. In the second two years of period, the number of books read by men increased significantly are responsible for 10000. The figure for books read by women increased by 200%. From 2013 to 2014, the percentage of books for women witnessed a significant decline, while the proportion of men reached a pick at 14000, which approximately was double than that of books read by women
The given line graph illustrates data on the book figures which have been read in Burnaby Public Library in 4 consecutive years by male and female. Overall, having been noted more significant for men, both genders seem to have increased their studying during the period. In 2011, men read around 3000 books in Burnaby Public Library compared to 5000 books women did. In the next year, the number of books which were borrowed from the library by male and female rose steadily and slightly at 4000 and 9000 respectively. In 2013, although the figures for both sexes were the same; both borrowing around 10000 books each; men’s trend maintained a steady increase and, the trend was reversed for women which experienced a dramatic decline. In the following year, per capita studying for men rocketed significantly to 14000. By contrast, studying for females followed a different pattern where the number of borrowings fell to around 9000.
The given line graph illustrates information about the number of books which have been read by male and female at Burnaby Public Library in four consecutive years. Overall, as is presented, although there was a reasonable difference between the men and women, the figures for both genders increased dramatically during the time period. In 2011, the number of books which were borrowed by men and women were approximately 3000 and 5000, respectively. By 2012, there had been a sharp rise for women, while men had experienced an insignificant increase until 2012. In contrast the last year, the increasing trend had reversed, it means that men had a dramatic increase but women increased slightly. The number of books read by women, after peaking at 10000 books in 2013, steadily fell to about 7000 books in 2014. The figure for men reached to the same amount in 2013, while in the following year it rose rapidly to 14000 at the end of period.
The given graph illustrates information about the mount of book readers by male and female at Burnaby public library during four years between 2011 and 2014. The overall trend shows a reasonable difference between men and women, so that the figures of man readers have increased, while the numbers of woman readers have experienced unsteadily trends. It is clear that, the number of books read by women sharply went up in the first three years. At the first time, it rose gradually from about 5000 till 8000 between 2011 and 2012, also the amount of male readers was just above 3000 in 2011, then it achieved slight growth and it decreased to half of the number of females after a passing time during this period. As can be seen, after 2012, they had a drastically upward trend in 2013, regardless of gender, the amount of them arrived to 10000. Ultimately the number of female reader declined dramatically and reach to just less than 7000 between 2013 and 2014, while the number of man readers surged twice amount of woman readers
The line graph illustrates the number of books read by both gender s over a four year period started from 2011 at Burnaby Pubic Library. It is clear that the number of books read by men and women dramatically increased over the period, whilst this number for women who read books at library was on rose till 2013 then gradually decreased. In both 2011 and 2012 years men read fewer books than women. In 2011 women read almost 5000 books, whereas men only read about 3000 books. However in 2012 this number only rose close to 4000 books, while women read around 8000 books at Burnaby Public Library. The books were read by men and women changed in 2013 and 2014. Both groups read as the same as each other in 2013 it was almost 10000 books, whilst this number in 2014 increased for men close to 14000, however it fell for women to almost 8000 books.
The shown line graph illustrates the number of book read by women and men at Burnaby Pubic Library of 2001 to 2016. In common ,the number of book read by men have rose sharply since 2013. In comparison the number of book read by women have plunged rapidly since 2013.
the given data presents give the number of books read at the Burnaby public library by men and women during the four years of 2011 to 2014. According to the 2014 figure, there is a big difference between the number of books read by men and women.
The line graph illustrates the number of books read by men and women at the Burnaby Public Library over a period of 4 years between 2011 and 2014. The graph shows us the number of books read by men and women has experienced a rise till 2013, but after that we see different trend in men and women. Increase trend in men has continued, in contrast the number of book read by women has diminished after 2013.
The line graph illustrates the number of books read by men and women at the Burnaby Public Library over a period of 4 years between 2011 and 2014. The graph shows us the number of books read by men and women has experienced a rise till 2013, but after that we see different trend in men and women. Increase trend in men has continued, in contrast the number of book read by women has diminished after 2013.
the supplied line graph compares the number of books read at the Burnaby Public Library by men and women during the four years.
The supplied line graph shows the comparison of the readen book by men and women .
the line graph gives the number of read books at the Burnaby public library by men and women during the four years of 2011 to 2014.increase trend in men has continued,in contrast the number of book read by women has diminished after 2013
At first glance, it can be seen that at the beginning, the books read by women were more than man, but after 2013 men surpassed . In a separate analysis the number of books read by women has increased in the first two year and then decreased in the final year , while the statistics for men have always increased.
in general, the number of books read by men has increased between 2011 to 2014, but this increase has seem faster since 2012 and but in relation to women, an increase in the number of books read has been seen from 2011 to 2013, but this number decreased from 2013 and reached its lowest level in 2014.
The supplied line graph illustrates the amount of books read by men and women at Burnaby public library during 4 years.
presented line graph shows the number of books read at the Burnaby Public Library by men and women during the four years off 2011 to 2014.
the line graph illustrates the amount of books read by men and women at Burnaby public library during 4 years from 2011.
the line graph shows the number of men and women that read books at burnaby public library over four years. As the graph shows us, there was a considerable upward in men book reader that just start over two thousand on 2011 and met 14000 participants on 2014, while the numbers for women book reader went up significantly till 2013, reached to ten thousand, then fallen near to two thousands in last year.
as is observed the number of books read by men saw a sharp upward trend but the number of books which are read by women sequentially increased till 2013 and speedily dropped afterward.
Generally speaking, as the line graph shows us, the number of books by men and women was on a steady increase till 2013, after that index of men on the rise dramatically, while the number of book read by women dropped down after 2013.
The given line graph represents the total number of books read by both genders – men and women – at Burnaby Public Library between the years 2011 and 2014. The x-axis represents the years whereas the y-axis shows the number of books read by both sexes. Between the years 2011 and 2012, the number of books read by women was twice as much as that of men. The men read about 3,000 books in 2011 which increased slightly to reach 4,000 books in 2012. On the other hand, the women read only 5,000 books in 2011 which increased moderately to about 8,000 books in 2012.
Detail 1: Overall, it is clear that the common point is 2013 for men and women. After that time, the number of books read by men shows increasing trend, whereas the number of books read by women is dramatically declining. Detail 2: In 2011, the number of books read by women and men was about 5000 and 3000, respectively. It can be seen that there was rise for both genders from 2011 to 2013 rapidly. By 2013, women reached their final point at almost 9000 and that year men also read the same amount of books as women. In the year 2014, the highest number of books read by men, at about 14000. On the other hand, women started to read fewer books than men. In total, it is possible to claim that men read more books than women.
The presented line graph show data on the number of books that read at the Burnaby Public library by men and women between 2011 and 2014. The initial impression is that the x-axis present the years while the y-axis gives information on the numbers of books read by two different groups of men and women. The number of books that read by two sexes indicate both increasing trend until 2013. In the year 2014 men experienced the highest level about the number of books read, while after 2013 the number of books that read by women declined suddenly.
The shown graph presents the number of books read by men and women at Burnaby Public Library from 2011 to 2014. As is observed, trend for the period is an increase, by men and women by 2013. the number of book read by men have rose sharply since 2013, however in same time ,the number of book read by women have dropped sharply.
The provided diagram shows data on the number of books read by men and women at Burnaby Public Library from 2011 to 2014. Overall, as is presented, the figures for both genders increased dramatically during the time period. On the other hand, the uplift in the number of books read by men is extremely impressive.
the supplied line graph illustrates the comparison between the number of books read at the Burnaby Public Library by men and women in the USA during the four years of 2011 to 2014. As the graph shows us, there is a tangible difference between the men and women, with the number of books read by men on a swiftly increase during these 4 years, while the number of books read by women rocketed until 2013, after that it plummeted mildly.
The presented diagram provides us with book readers’ numbers in two sex, men and women, between 2011 and 2014. According to the graphs, there were changes from an increasing trend to a decreasing trend in the graph of women. However, In general, there was an upward trend in both gender.
Numeric amounts of books read by people in three years at Burnaby Public library has shown in the presented line-graph.
The supplied diagram compares the number of books have read between men and women in 3 years
لطفا وارد شوید و نظر خود را ثبت نمایید.
بهترین ها
| نام | تعداد آزمون | میزان موفقیت | |
|---|---|---|---|
| َAmeneh Darvishzadeh | 1 | 100/00 % | |
| Mehrad Hashemi | 1 | 100/00 % | |
| مهدی حسین پور آقائی | 1 | 100/00 % | |
| Farnoush Toghiany | 21 | 98/36 % | |
| zahra namdari | 46 | 98/21 % | |
| یاسمن محمدی پور | 4 | 98/08 % | |
| Sheida Taheri | 3 | 97/37 % | |
| پژمان همدانی | 3 | 97/37 % | |
| محمدحسین میرزایی | 3 | 97/30 % | |
| Tara Mohammadi | 3 | 96/43 % | |
| yasaman mohamadipur | 51 | 95/86 % | |
| محمدجواد ملائی اردستانی | 3 | 94/44 % | |
| Arzhang Saberi | 4 | 93/33 % | |
| Soheila Karimi | 124 | 92/73 % | |
| aram farhmand | 10 | 92/31 % | |
| یاشار اسکندری | 98 | 91/14 % | |
| الشان مقیمی آذر | 11 | 90/80 % | |
| عباس پورمیدانی | 1 | 90/00 % | |
| پریسا سلوکی شهرضایی | 72 | 89/49 % | |
| ارشیا قلمکاری | 33 | 89/23 % |


