محتوای الکترونیکی
Line Graph Sample

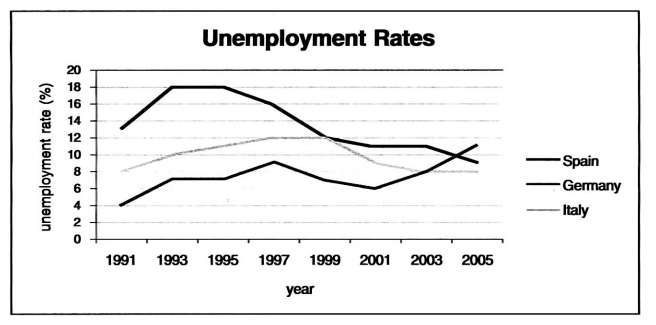
The line graph below gives information about the rates of unemployment between 1991 and 2005 in three different countries in Europe. The table shows the percentage of men and women in the workforce in these three countries. Summarise the information by selecting and reporting the main features, and make comparisons where relevant.
| Country | Men | Women |
| Germany | 76.5% | 54.4% |
| Spain | 66.2% | 32.3% |
| Italy | 77.1% | 37.8% |
Sample Answer
The graph shows unemployment levels in three countries from 1991 to 2005 while the table gives the proportion of men and women in these countries who worked in 1991.
In 1991, Spain had the highest unemployment rate at 13% increasing markedly to 18%( 1993-1995), then falling steadily to 9% in 2005. In contrast, unemployment was low in Germany, starting at 4% but climbing gradually to 9% in 1997, dipping to 6% in 2001 and increasing to a high of 11% in 2005. Italy’s unemployment rate fluctuated less than the others, starting and finishing at 8% over this period and reaching a maximum of 12% from 1997 to 1999.
Vocabulary
- The graph shows
- The table gives the proportion of
- Increasing markedly to
- Falling steadily to
- In contrast
- Climbing gradually to
- Dipping to
- Increasing to a high of
- Fluctuated less than the others
- Just over half
- More than three-quarters of
- A third of
- Downward trend
23 نظر
The line graph given illustrates some information about the unemployment rates from 1991 to 2005 in Germany, Spain, and Italy, on the other hand, the table shows the percentage of men and women in the workforce in the same three countries mentioned. In the beginning, the three countries rose slightly until 1992; however, Spain became steady from 1993 to 1995 when their unemployment rate was 18%. Then after 1995 dramatic fall can be observed. In 1999, Italy and Spain crossed each other with a 12 percent unemployment rate. However, after 1999, Spain had a gradual drop from 12 percent. Nevertheless, on behalf of Germany, it fluctuated until 2001, which then became a sharp rise from the lowest unemployment rate in 1991 to the highest among the three countries. In 1991, employees were primarily males with the highest percentage among them was Italy. However, for the female topic, the highest belongs to Germany.
The line graph illustrates unemployment levels in three countries from 1991 to 2005 while the table gives information on the amount of men and women in these countries who worked in 1991. In general,In 1991, Spain had the highest unemployment rate increasing markedly ( 1993-1995), then falling steadily in 2005. In contrast, unemployment was low in Germany, starting but climbing gradually in 1997, dipping in 2001 and increasing to a high of in 2005. Italy’s unemployment rate fluctuated less than the others, starting and finishing over this period and reaching a maximum from 1997 to 1999.
The peresented line graph shows some information on the unemployment levels from 1991 to 2005 in Germany, Spain, and Italy however, the figure provides the proportion of men and women in these countries who worked in 1991. in general, the three countries increesed slightly until 1992.Spain became steady from 1993 to 1995.
The peresented line graph shows some information on the unemployment levels from 1991 to 2005 in Germany, Spain, and Italy however, the figure provides the proportion of men and women in these countries who worked in 1991. in general, the three countries increesed slightly until 1992.Spain became steady from 1993 to 1995.
The given line graph compares the differences levels of unemployment rates in three countries in Europe of 1991 to 2005, including Italy,Germany,Spain. In general, Italy and Spain decreased unemployment rate of other county from1999 to 2005. According to the line graph , Germany increased sharply unemployment rate of other countries since 2001.
the presented line graph describes the rates of unemployment between 1991 and 2005 in three different countries in Europe.In general, Germany has the highest percentage of men and women in the workforce among the three countries
the given line graph here compares the percentage of unemployment in three European countries over the period of 14 years.
The supplied line graph illustrates proportion of unemployment from 1991 to 2005 .
In general,Germany seem to have taken a major percentage of men and women in the workforce among the three countries.
the given line graph below provides about the differences rates of unemployment between 1991 and 2005 in three European countries . The provided table shows the proportion of men and women who worked in these countries in 1991.
The given line graph illustrates the proportion of the employment rates between three European countries in the 90's and early 2000's. As well, the table compares this factor as a function of gender in 1991
in general unemployment rates in Spain and Italy plummet slightly throughout the period but in Germany from 2001 it increased gradually.
At a glance, the Spain had highest level of unemployment rate in 1991 that had climbing gradually to 18%between 1993 to 1995 then dropped down steadily in 2005. On the other hand, in Germany and Italy despite fluctuations, unemployment rates respectively, has increased and decreased.
The line graph provides information about how much unemployment rates had changed between 1991 and 2005 while the table examines percentage of men and women in the labour market in Spain, Germany, and Italy in the year 1991. In Spain, 13% was the unemployment rate in 1991, inclined 18% between 1993 to 1995, gradually falling to 9% by the year 2005, which shows the increased employment rate in the period 1995 to 2005. Italy had the 8% of jobless people in 1991 & 2005 and rose to 12% in 1997. Germany had the lowest level of unemployment, 4% in 1991, which moderately increased to 9% in 1997 finally it reached 11% in 2005.
Detail 1: Overall, it clearly to see from the line chart the unemployment rates of Spain and Italy decreased dramatically when the rate in Germany increased slowly from 1991 to 2005. We can also see from table that the employment rates of men were higher than the rate of women in those countries in 1991. Detail 2: In the line graph, in 1991, the rate in Spain was highest for 13% and the rate in Germany was lowest 4%. In 1993, the rates in 2 countries increased gradually, Spain was 18% while Germany was 7%. They remained stable until 3 years later. From 1995 to 2001, the rates in Spain and Germany fell dramatically, the rate in Spain was 9% and in Germany was 6%. In 2005, the unemployment rate in Spain remained the same and the rate in Germany soared, reached 13%. We can see in the table, in 1991, the employment percentages of men in Germany was higher than women in Germany and highest of 3 countries. The second was the employment rate of men in Italy and finally was Spain.
In the last three years, Spain's unemployment rate increased from 13% to 18%. Between 1993 to 1995. The percentage of unemployed people saw no change. Numbers decline by almost 6% from 1995 Through to 1999. The trend was obviously downward from 1995 to 2005. As is observed the percentages changed from 18% to nearly 10% in Spain. But unemployment rates saw a completely different change in Germany compared to Spain. As you can see the percentages start from 4% and during 14 years it saw a blowing mind increase! And reach 12%. In the first five years, we can see a gradual increase in unemployment rates in Italy. From 1991 to 1999 the percentage of unemployment in Italy Rose by approximately 4%. Stability in The percentages of unemployment from 1997 to 1999 Was followed by a downward trend from 1999 to 2005.
The graph provides unemployment levels in three European countries in one 15 years period. the table gives the proportion of men and women who worked in these countries in 1991. At a glance, Spain and Germany had downward and upward trends respectively while, unemployment rate of Italy a part from small rise, remains stability during the period. In 1992, employment index of men in these countries had been doubled of index of women. In 1991, Spain had the highest unemployment level at 13% climbing dramatically to 18% and then dropped by 6% in 1999 also from 2001, had gradual fall to the end of period. In contrast, these rate in Germany starting at 4% and fluctuating up and down till 2001 which rising moderately to nearly 12% in 2005. Unemployment rate of Italy waved less than other. In 1991, Germany and Italy had highest percentage of worker among of men that was 76.5% and 77.1% respectively and in Spain with slight deference form them was 66.2%. The proportion of women who worked, in Germany was highest (54.4%) while, these index was approximately same in Spain and Italy(32.3% and 37.8% respectively).
The presented figure shows data about the percentage of unemployment in three different countries from 1991 to 2005. It can clearly seen, unemployment in Spain and Italy had a moderate decline whereas in Germany unemployment rate raised progressively.
The provided diagram shows data on rates of unemployment between 1991 and 2005 in three different countries in Europe. The table shows the percentage of men and women in the workforce in these three countries. Overall, The unemployment rate in Spain has decreased slightly over the past 70 years, except Italy, where the unemployment rate has remained constant over the years.On the other hand, the unemployment rate in Germany has increased sharply.
the supplied line graph gives the proportion of unemployment levels in three countries from 1991 to 2005, while the given table shows data about employment rates of men and women in three countries in Europe in 1991. in general, unemployment rate in Spain has had slightly increase in 1991 and this graph shows in Italy an unemployment rate remained constant in 1991.
The supplied figure describes data about the rates of unemployment between 1991 and 2005 in Germany, Spain, and Italy. The table represents the percentage of men and women in the workforce in these three countries. In general, Germany has the highest percentage of men and women in the workforce among the three countries, on the other hand Spain has the lowest percentage of men and women in the workforce among the three countries.
fluctuations in rates of none-employment of both genders included in several European countries in late nineteens and early twenties is being described in the presented illustration.
The given illustration gives data on the proportion of unemployment rate between 1991 and 2005 in three different countries in Europe
لطفا وارد شوید و نظر خود را ثبت نمایید.
بهترین ها
| نام | تعداد آزمون | میزان موفقیت | |
|---|---|---|---|
| َAmeneh Darvishzadeh | 1 | 100/00 % | |
| Mehrad Hashemi | 1 | 100/00 % | |
| مهدی حسین پور آقائی | 1 | 100/00 % | |
| Farnoush Toghiany | 21 | 98/36 % | |
| zahra namdari | 46 | 98/21 % | |
| یاسمن محمدی پور | 4 | 98/08 % | |
| Sheida Taheri | 3 | 97/37 % | |
| پژمان همدانی | 3 | 97/37 % | |
| محمدحسین میرزایی | 3 | 97/30 % | |
| Tara Mohammadi | 3 | 96/43 % | |
| yasaman mohamadipur | 51 | 95/86 % | |
| محمدجواد ملائی اردستانی | 3 | 94/44 % | |
| Arzhang Saberi | 4 | 93/33 % | |
| Soheila Karimi | 124 | 92/73 % | |
| aram farhmand | 10 | 92/31 % | |
| یاشار اسکندری | 98 | 91/14 % | |
| الشان مقیمی آذر | 11 | 90/80 % | |
| عباس پورمیدانی | 1 | 90/00 % | |
| پریسا سلوکی شهرضایی | 72 | 89/49 % | |
| ارشیا قلمکاری | 33 | 89/23 % |


