محتوای الکترونیکی
IELTS Pie Chart
In IELTS Writing task 1 of the academic section, there will be a visual representation or a diagram on which you have to write a paragraph. One of these visual representations may be pie charts.
Pie Charts are circular charts that are divided into sections or pie slices usually representing the percentages. Each section of the pie chart shows the percentage of data that it represents. When you put all the sections together it forms a circle.
The Pie charts are most commonly used in the multimedia and the business world and less commonly used in scientific and technical publications.
Interpreting pie charts
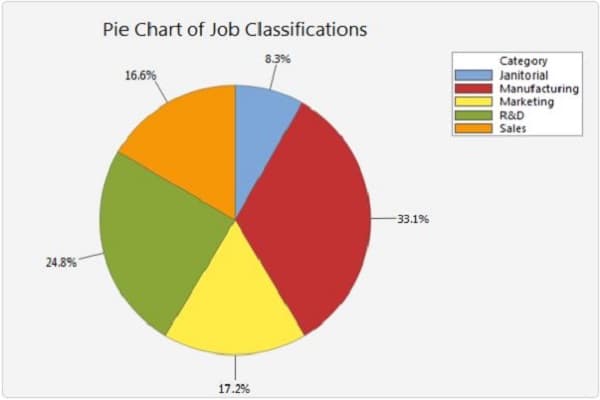
From the pie chart, we can answer the following questions:
What is largest proportion of jobs?
Manufacturing
What is smallest proportion of jobs?
Janitorial
Steps to write a Pie Chart
There are certain steps that you need to follow while describing the Pie Chart. You can follow the below steps:
Introduction
You have to begin the chart with an introduction. The introduction can go up to 2 sentences and while introducing you can paraphrase the sentence that is already there in the question. You need to include two points. Firstly, what is your graph showing and secondly, the time period?
General Overview
In the second paragraph, you need to write a general overview of the graph. You need to pick some main features from the chart and explain it. Firstly, you can take the biggest or the smallest sections from the pie chart and explain it. Secondly, identify the ones that didn’t change over time. You can choose to write on any one of the options, but do not write both.
Specific Details
In the last paragraph, you have to write about the specific details. You can split the group of specific details into two or three paragraphs. You can group the specific details in the following manner:
Firstly based on the sectors that have increased and secondly based on the factors that have decreased or didn’t change.
Points to Remember while writing a Pie Chart
There are few points which should be borne in mind while explaining the pie chart. They are as follows:
- What you write must match the tense. This means that if the picture of the pie chart is in the present, then your explanation should also be in the present tense. If your chart represents the past, then your explanation should be in the past tense.
- The answer that you write should be of 150 words. It might get rejected, otherwise. When you write the explanation, you must ensure that your answer is at least 155- 160 words, so that it doesn’t get rejected.
- Many times, comparing two charts is easier than writing an explanation for a single chart. So you need to focus on every detail in order to get strong points to write regarding the chart.
- The answer that you write must match correctly with the chart. You need to be extremely careful while writing the explanation. So take a clear look at the chart before beginning to write on it.
Tips for describing Pie Charts
- You have to read the heading and the data labels of the chart carefully so that you get to know what are the main details included and get an idea on how to write the explanation for the same.
- While writing the introduction, you need to refer to the chart which you are going to explain.
- In the subsequent paragraphs, you can show a comparison between the two pie charts. It may be either differences or similarities.
- When describing a pie chart, you must make use of appropriate vocabulary. For example, when relating information, use words like ‘related to’, ‘connected to’ and so on.
- Usually, the largest section in the pie chart will be important. You can skip the sections that will have “other” if you do not have much time, and if the word count is already more than 150 words.
- You can use different words while describing proportions and percentages.
- Do not mention anything which is not included in the pie chart data. There must be no deviations from the data that is given.
- You must read the question carefully so that you know in what tense it is set. Your answer should also be in the same tense. Usually, the chart given will be in the past tense. So your explanation should obviously be in the past tense.
IELTS Pie Chart Vocabulary :
In writing task 1 of the Academic module, there is a dedicated vocabulary for the pie chart. IELTS pie chart description must be done accordingly. Here is some sample vocabulary:
When describing fractions, use words given below:
- 73%- nearly three quarters
- 51%- just over a half
- 49%- just under a half
When describing increases/decreases, use words given below:
Noun phrase + verb + adverb
There + be + noun + in + noun phrase
بهترین ها
| نام | تعداد آزمون | میزان موفقیت | |
|---|---|---|---|
| َAmeneh Darvishzadeh | 1 | 100/00 % | |
| Mehrad Hashemi | 1 | 100/00 % | |
| مهدی حسین پور آقائی | 1 | 100/00 % | |
| Farnoush Toghiany | 21 | 98/36 % | |
| zahra namdari | 46 | 98/21 % | |
| یاسمن محمدی پور | 4 | 98/08 % | |
| Sheida Taheri | 3 | 97/37 % | |
| پژمان همدانی | 3 | 97/37 % | |
| محمدحسین میرزایی | 3 | 97/30 % | |
| Tara Mohammadi | 3 | 96/43 % | |
| yasaman mohamadipur | 51 | 95/86 % | |
| محمدجواد ملائی اردستانی | 3 | 94/44 % | |
| Arzhang Saberi | 4 | 93/33 % | |
| Soheila Karimi | 124 | 92/73 % | |
| aram farhmand | 10 | 92/31 % | |
| یاشار اسکندری | 98 | 91/14 % | |
| الشان مقیمی آذر | 11 | 90/80 % | |
| عباس پورمیدانی | 1 | 90/00 % | |
| پریسا سلوکی شهرضایی | 72 | 89/49 % | |
| ارشیا قلمکاری | 33 | 89/23 % |