محتوای الکترونیکی
IELTS Table Chart
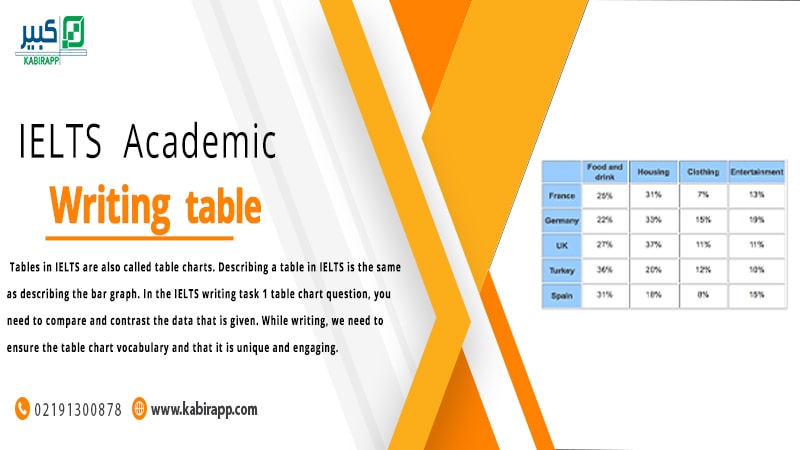
IELTS Writing task 1 table
Tables in IELTS are also called table charts. Describing a table in IELTS is the same as describing the bar graph. In the IELTS writing task 1 table chart question, you need to compare and contrast the data that is given. While writing, we need to ensure the table chart vocabulary and that it is unique and engaging.
How to describe a table in IELTS writing?
There are different ways in which you can describe an IELTS table. Some of them are listed below:
Summarizing the Table
In order to describe the table, you should analyze whether the question is in the past, present or the future and the answer should be composed accordingly. Alongside, you are also required to build a ielts task 1 table vocabulary list which will help you to explain the question effectively.
Dividing the data
You can divide the data given into different sections so that it is easy for you to explain and also to understand. You can also find out data which is unique.
Clearly state your point
The way you structure your answer is very important because it reflects your flow of thoughts. You can create your own structure as there are no hard and fast rules to it. One way to explain the given data is to divide the main features into different paragraphs. This will enable you to state your point about each main feature.
Compare and Contrast data with exceptions
Usually, there will be 2 paragraphs to explain the main features of the data given. In the first paragraph, you can give an overview of the data that is given. In the second paragraph, you can talk in-depth about the table. And as a conclusion, you can write a detailed summary of everything.
Tips for interpreting a table in IELTS
Here are some of the tips on how you can write the table that is given in the IELTS examination:
- The test takers are asked to include all the main features in the overview paragraph while writing the test. You need to keep in mind that you have to write multiple main features, in order to score a high band.
- Divide the points into different paragraphs. So it will be easy for you also to explain, as well as readable for the examiner.
- You don’t have to give all the details included in the table. Just write the main features which are available and explain it properly so that it is effective.
- Do not try to include every detail. Select some areas in the graph which will be easy for you to explain.
- It is mandatory that you write 150 words else you be penalized. You should also bear in mind that your explanation does not exceed 200 words.
- You can use some linking words while explaining your data. They will make it professional and you can complete 150 words quickly. But, make sure that the linking words are used appropriately.
- When you write the explanation try not to repeat words or sentences.
- Paraphrasing skills will be a great asset.
IELTS Writing Task 1 Vocabulary: Table
Some linking words
- As long as/Provided that
Eg : You can use the water purifier as long as/provided that it doesn’t remove the essential nutrients.
- Although/Even though
Eg: Although/Even though he is knowledgeable, he didn’t perform well in the exams.
- Even if
Eg: Even if they win the match, they can’t make it to the finals.
- Wherever
Eg: Use adjectives wherever necessary.
- Whenever
Eg: Drink water whenever you feel hungry.
- Whereas
Eg: Tom and Dick are brothers. Tom is intelligent whereas Dick is not.
- Whatever
Eg: Please do whatever I say.
- So that
Eg: She dressed up early so that she could be in time for the function.
- In spite of/despite
Eg: Despite/In spite of repeated reminders, Sarah’s team did not fill the timesheet.
Testing Criteria
There are some criteria on which the explanation is tested. Please find below, the criteria by which you are evaluated:
- How precisely you can describe the data that is mentioned on the table.
- How well you can compare and contrast the data that is given.
- When describing a table, you have to explain what is mentioned and not give your own opinion.
- Usage of tone is also taken into account.
Guidelines to write a good answer
There are few guidelines to be followed to write a good answer to the table question. They are:
The explanation should have a proper structure
The explanation given should be in a proper structure including the introduction, the body paragraph as well as the conclusion. It will be good if the explanation also has connective words so that you can write 150 words quickly and ensure it is cohesive.
The explanation should have suitable grammar and vocabulary
You should make sure that the sentences used in the explanation are not repetitive. They should be unique with a good vocabulary.
The explanation should meet the requirements of the task given
The explanation should compulsorily be of 150 words. Anything less than that may result in a penalty. The main features of the table should be highlighted and explained appropriately, and the important trends on the table must be captured or highlighted appropriately.
Here are the 10 examples for the Table chart:
بهترین ها
| نام | تعداد آزمون | میزان موفقیت | |
|---|---|---|---|
| َAmeneh Darvishzadeh | 1 | 100/00 % | |
| Mehrad Hashemi | 1 | 100/00 % | |
| مهدی حسین پور آقائی | 1 | 100/00 % | |
| Farnoush Toghiany | 21 | 98/36 % | |
| zahra namdari | 46 | 98/21 % | |
| یاسمن محمدی پور | 4 | 98/08 % | |
| Sheida Taheri | 3 | 97/37 % | |
| پژمان همدانی | 3 | 97/37 % | |
| محمدحسین میرزایی | 3 | 97/30 % | |
| Tara Mohammadi | 3 | 96/43 % | |
| yasaman mohamadipur | 51 | 95/86 % | |
| محمدجواد ملائی اردستانی | 3 | 94/44 % | |
| Arzhang Saberi | 4 | 93/33 % | |
| Soheila Karimi | 124 | 92/73 % | |
| aram farhmand | 10 | 92/31 % | |
| یاشار اسکندری | 98 | 91/14 % | |
| الشان مقیمی آذر | 11 | 90/80 % | |
| عباس پورمیدانی | 1 | 90/00 % | |
| پریسا سلوکی شهرضایی | 72 | 89/49 % | |
| ارشیا قلمکاری | 33 | 89/23 % |