محتوای الکترونیکی
IELTS Writing Task 1 – Bar Chart/ Graph

IELTS question paper will usually have a question on the bar graph. The bar graph is also called a bar chart. It is measured in the same way as the line graph. IELTS bar chart also has two axes, which shows the change over time. The bar graph will have rectangular bars, which can be shown horizontally or vertically. It represents the data with 2 or more values.
Bar Graph IELTS – An explanation:
Types of Bar Graphs:
There are two types of bar graphs. They are:
- Vertical bar graph
- Horizontal bar graph
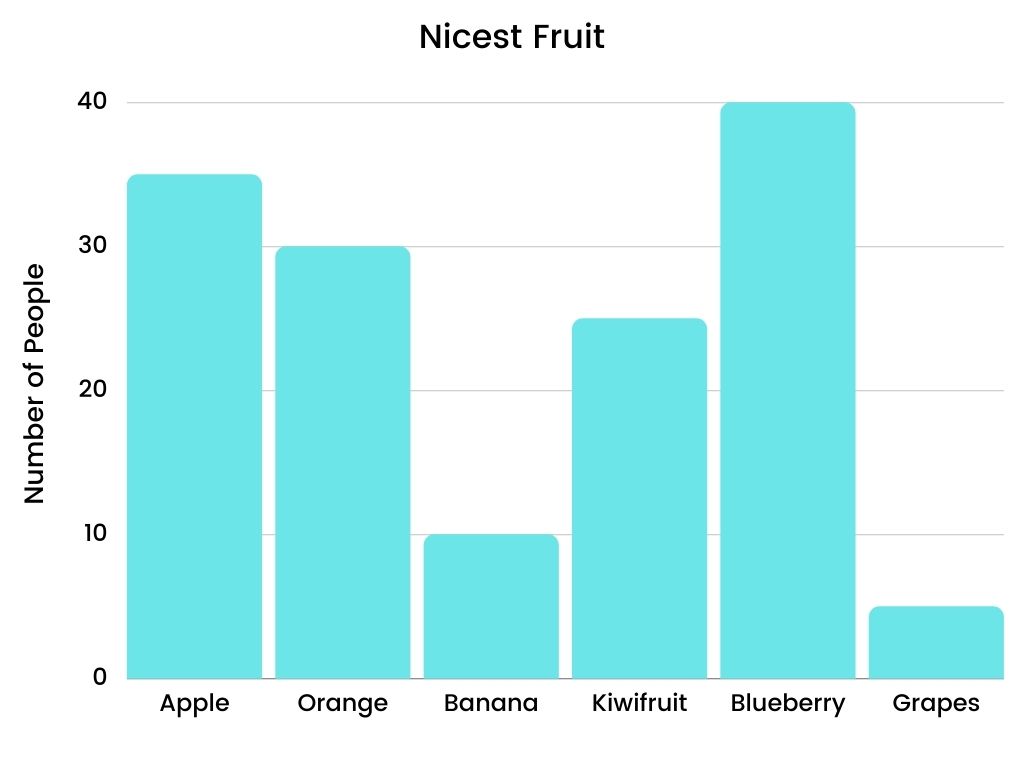
Vertical bar graph task 1
Example:

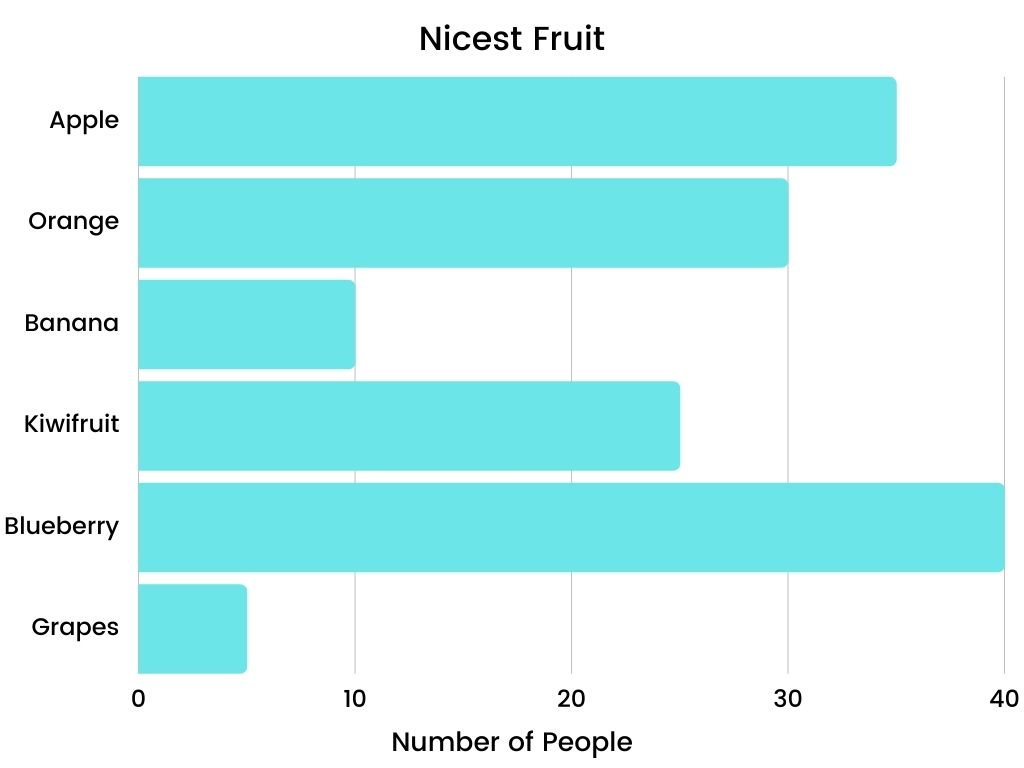
Horizontal bar graph task 1
Example :

Steps in Writing a Good IELTS Bar chart Essay
There are some steps that can be followed to write a good IELTS bar essay. If you follow this process it will be easy for you to remember the important points during the exam.
Analyze the Question
The first step is to analyze and understand the question. The questions will be a brief description of the graph, instructions about the graph, chart or table. Identifying the central idea is very important.
Analyze the data given
Analyze whether the data given is static or dynamic.
Static data: Bar graph displays only one period of time.
Dynamic data: It shows two or more periods of time.
You will have to use different language to describe both.
Identify the main features
You should find the bar graph questions quite easy to answer because they test your language skills and not mathematical skills. You should be in a position to derive the main feature and write about it.
How to describe a bar chart in IELTS?
Write an Introduction
All you need to do in the introduction is to paraphrase the question that is asked. You can use synonyms and rephrase the question. It is important that the language used should sound natural.
Write an Overview
This is usually done in the second paragraph where the main features identified are clearly explained. In this paragraph, you have to spot any comparisons that are available. You can also write about the general trends that occur in the data given.
Write the first detailed paragraph
In this paragraph, you give detailed information about the data given. You should concentrate on language rather than the facts. Make a relevant comparison of the data given.
Write the second detailed paragraph
In this paragraph, you have to explain the remaining main features in detail. It is the same as the first detailed paragraph.
Tips on describing the Bar Chart
There are few tips which are used for describing the bar graph which is as follows:
- Try to use a simple language while describing the bar graph.
- After writing, review the content that you have written, and check if it is free from errors and plagiarism. Try to add any extra words which will suit the data given.
- While practicing, use different bar graphs or charts, so that you improve your ability to explain different types of graphs and charts.
- You also have to review the superlatives which are the important features.
- You can also write a conclusion, with reference to the bar graph. You can gain more marks if you can understand and interpret the bar graph.
How to choose the information from the Bar Graph?
Bar Graph question should be a 150 words essay with 10-15 words in a sentence. It is not necessary that it should be in a particular structure. Some of the things that can be followed while writing the essay is as follows:
- One sentence for the introduction.
- Two sentences for the main features.
- One sentence for the comparison.
- One sentence that groups 2 data points because they are same
- One sentence that notes the exception.
- One sentence that describes the data in depth.
- Two sentences for the summary.
- EXAMPLE 1
- EXAMPLE 2
- EXAMPLE 3
- EXAMPLE 4
- EXAMPLE 5
- EXAMPLE 6
- EXAMPLE 7
- EXAMPLE 8
- EXAMPLE 9
- EXAMPLE 10
بهترین ها
| نام | تعداد آزمون | میزان موفقیت | |
|---|---|---|---|
| َAmeneh Darvishzadeh | 1 | 100/00 % | |
| Mehrad Hashemi | 1 | 100/00 % | |
| مهدی حسین پور آقائی | 1 | 100/00 % | |
| Farnoush Toghiany | 21 | 98/36 % | |
| zahra namdari | 46 | 98/21 % | |
| یاسمن محمدی پور | 4 | 98/08 % | |
| Sheida Taheri | 3 | 97/37 % | |
| پژمان همدانی | 3 | 97/37 % | |
| محمدحسین میرزایی | 3 | 97/30 % | |
| Tara Mohammadi | 3 | 96/43 % | |
| yasaman mohamadipur | 51 | 95/86 % | |
| محمدجواد ملائی اردستانی | 3 | 94/44 % | |
| Arzhang Saberi | 4 | 93/33 % | |
| Soheila Karimi | 124 | 92/73 % | |
| aram farhmand | 10 | 92/31 % | |
| یاشار اسکندری | 98 | 91/14 % | |
| الشان مقیمی آذر | 11 | 90/80 % | |
| عباس پورمیدانی | 1 | 90/00 % | |
| پریسا سلوکی شهرضایی | 72 | 89/49 % | |
| ارشیا قلمکاری | 33 | 89/23 % |